Florida is one crazy state. Its state leaders interfere in every aspect of people’s lives. Under the leadership of Governor Ron DeSantis, it passed a rigid abortion ban, denying every woman in the state the right to control her body and her life choices.
DeSantis has led a campaign to destroy the state’s public schools, so the state now spends billions yearly to subsidize charter schools, unaccountable voucher schools, and home schooling. Most of the voucher schools are religious schools with uncertified teachers.
As his Surgeon General, DeSantis chose a doctor with extremist views against vaccines. Parents can still get their children vaccinated, but they will be in school with unvaccinated children.
Dr. Joseph Ladapo’s goal is to eliminate all vaccine requirements.
TALLAHASSEE — The Florida Department of Health is moving forward with its push to remove the requirement for four vaccines for children entering schools, but has dropped its attempt to expand exemptions for the immunization requirements.
In August, the DOH struck the words “sincerely held moral or ethical belief” from a proposed rule change that would have allowed parents to opt not to get their children vaccinated for various diseases, which are normally required to attend K-12 public schools. The exemptions currently in place must be based on religious tenets and practices.
Meanwhile, the DOH also announced a public meeting next Thursday in Lake Mary to discuss repealing the requirement of four vaccines from entry requirements for PreK-12 public and private schools.
Immunizations for Hepatitis B, varicella (chicken pox), Haemophilus influenza type b (Hib) and pneumococcal conjugate would no longer be required to attend Florida schools under the proposal. The move has been in play for over a year after Surgeon General Joseph Ladapo announced his intent to get rid of all vaccine mandates in the state.
The immunization requirements considered for repeal by DOH are an agency rule, not in state law, and can be repealed by the agency itself. The Florida chapter of the American Academy of Pediatrics said in a statement they “remain concerned,” about the state’s move to weaken the state’s vaccination mandates.
“Florida’s pediatricians will continue to make their voices heard in opposition to this proposed rule that would undermine the health of Florida’s children and communities,” the statement reads. “When school vaccine protections are eliminated, immunization rates decrease, leaving more people, including those too young or medically unable to be vaccinated themselves, vulnerable to contracting these dangerous illnesses.”
In a comment submitted by FCAAP in opposition to the proposed rule, the advocacy group estimated the repeal of vaccination requirements in Florida would result in a reduction of the state’s GDP by $74 million in the first year and nearly $9 billion over a decade.
Attempts to repeal all vaccine mandates in the state began over a year ago when Gov. Ron DeSantis and Ladapo called on the Legislature to change state law. Legislative action is needed to remove the requirements for the measles, mumps and rubella vaccine, polio, diphtheria, rubeola and tetanus vaccines.
But even though the move to repeal all vaccine mandates was supported by DeSantis, First Lady Casey DeSantis and then-Education Commissioner Anastasios Kamoutsas, no legislator filed a bill in any of the multiple legislative sessions in 2026.
Multiple attempts at a “Medical Freedom” bill that would have expanded vaccine exemptions and mandated doctors to provide an alternate vaccine schedule passed the state Senate but failed to pass the state House.
Republican Senator Roger Marshall is in a close race with Democrat Rev. Adam Hamilton in Kansas. Senator Marshall used to be an obstetrician. Sarah Kliff of The New York Timeswent through state records and discovered that he has an ugly history. Of course, patients should pay their bills. But is it really necessary to have them arrested?
The Times reported:
It was Easter weekend in 2007 when a police car pulled up to Joe Vasquez’s home in rural Kansas.
A doctor had filed a lawsuit against him and his wife over an unpaid $4,561 bill from her emergency hysterectomy three years earlier. They had missed a court date, and the doctor’s lawyers asked the court to issue an arrest warrant.
The police took the couple into custody as their grandchildren prepared for an egg hunt, Mr. Vasquez said. They spent two days in jail before their son could borrow the money to post bond.
“We had no money to pay,” said Mr. Vasquez, now 68. At the time, his wife was working at a manufacturing plant and he was on disability, he said.
The doctor who sued the couple was Roger Marshall, now a senator from Kansas. Mr. Marshall, a Republican who is seeking re-election this fall, filed lawsuits against more than 700 patients with outstanding bills during his decades-long career as an obstetrician-gynecologist, according to a New York Times analysis of Kansas court records.
Patients were arrested in 81 of those cases for missing court dates, the records show. In an additional 13 lawsuits, Mr. Marshall’s lawyers sought warrants but it is unclear whether an arrest occurred.
They also garnished patients’ paychecks and bank accounts. They routinely charged patients an 18 percent annual interest rate.
The unpaid bills ranged from several thousand dollars to as little as $101. About half the lawsuits were filed under Mr. Marshall’s name and the rest by Heartland Regional OBGYN, the medical practice he solely owned from 1998 to 2012 and then co-owned with another doctor from 2013 to 2019.
Some facing lawsuits were new mothers with outstanding bills from their deliveries. Most lived in Barton County, a rural area with above-average uninsured and poverty rates. Some patients The Times spoke with lacked insurance; others had health coverage but were responsible for part of their bill.
“I had every intention to pay, I was just struggling,” said Kellie Clutts, whom Mr. Marshall sued in 2015 over a $129 bill. Ms. Clutts said the charge was from a postpartum visit shortly after her daughter’s birth.
Mr. Marshall sued Ms. Clutts when her baby was 9 months old and eventually garnished her bank account.
“I was recently divorced, trying to do everything on my own,” said Ms. Clutts, 45. “I told them I could make partial payments, but it seemed like no matter what I said, they wanted the full amount at once….”
Doctors have wide discretion in how to handle unpaid bills. They can decide when to involve a debt collector, file lawsuits or drop the debt entirely if a patient seems unable to pay.
“There is a lot of variation,” said Barak Richman, the co-director of the health law program at George Washington University who has studied medical debt litigation In threestates. “There are a lot that do bring lawsuits but also a whole lot that don’t. It’s not because they’re in a different position, they’ve just decided they’re not going to do it.”
Some hospitals and doctors have increasingly relied on litigation as insurance deductibles have risen, leaving patients responsible for a great share of their bills.
Even so, wage garnishments and arrests of patients are “definitely on the extreme side,” Mr. Richman said.
Neale Mahoney, an economist at Stanford University, has conducted research in one state finding that lawsuits against patients are relatively rare, with about 1.7 percent of hospital stays resulting in litigation.
“It’s not surprising there are outliers but this does seem to be an extreme case,” in terms of how far a doctor went to pursue debt, Mr. Mahoney said.
The fabulous cabaret singer Sophie Tucker, well known in the mid-20th century, said: “I’ve been rich and I’ve been poor. Believe me, rich is better.”
If children have any say in the matter (they don’t), they should arrange to be born to a rich family. They would get regular medical care, nutritious meals, live in nice houses in safe neighborhoods. And their schools would get high ratings!
Here is this morning’s post with new analysis addedtoday from the Cleveland Plain Dealer’s data wonk, Rich Exner, on the meaning of Ohio’s 2026 School Report Cards.
Leading with a bar graph correlating the Census Bureau child poverty rate with Ohio school districts’ overall school report card rankings, Exner demonstrates that, once again in 2026, Ohio’s ratings of the state’s public school districts on the annual state report card correlate with school districts’ aggregate family income and other factors known to contribute to opportunity gaps. The Ohio Department of Education and the Workforce (Ohio DEW) rates and ranks Ohio school districts based on standardized test scores along with several other factors the state now considers such as graduation rates and the amount of chronic absence among students.
Exner writes: “The 2026 Ohio school report cards released this week not only provided a snapshot of each school district, but they also once again drove home the point that wealthier districts usually do better, a cleveland.com analysis found. Perhaps the relationship is no clearer than in comparing districtwide child poverty rates from the Census Bureau to the overall star ratings issued by the Ohio Department of Education and Workforce. Five-star districts, on average, have a child poverty rate of 6.1%, whereas schools scoring on the low-end with just two stars are nearly six times worse off for child poverty, at 35.1%, cleveland.com found. The trend holds true at each step between, with child poverty averaging 8.5% for 4.5-star districts, 12.8% for four-star districts, 15.6% for 3.5-star districts, 23% for three-star districts and 30.1% for 2.5-star districts.”
Children’s test scores also correlate with related factors. For example, “Within the districts receiving two stars, just 15.6% of the adults age 25 and older have a bachelor’s degree or above. In the five-star districts, the rate is more than three times as high, at 48.5%.”
Exner examines the correlation of a each school district’s aggregate child poverty rate and the percentage of adults with a B.A. or above with the state’s overall ratings, and with rankings in each of the subcategories the state considers: school achievement as measured by test scores; progress; gap closing; graduation rates; early literacy; and college, career workforce, and military readiness. In each case he confirms the years-long trend correlating the state’s ratings of public schools with socioeconomic factors.
—– Here is the original post published this morning —–
Earlier this week, the Ohio Department of Education and the Workforce (Ohio DEW) released state report cards for each Ohio school district and every one of the state’s traditional public schools and charter schools. The Plain Dealer‘s Laura Hancock reports: “Overall, English and math scores inched up statewide. The rate of chronic absenteeism inched downward and remains far from the state’s goal.”
A follow-up from Plain Dealer reporter Rich Exner lists Ohio’s top scoring schools: “Solon was among three Cuyahoga County districts scoring in the top five, and among 10 from the Greater Cleveland area in the top 25 statewide… Following Solon at the top of the list, in order, were Marion schools from western Ohio’s Mercer County, Chagrin Falls, Mariemont from outside Cincinnati, and Rocky River.” The three greater Cleveland districts in that list are Solon, Chagrin Falls and Rocky River, all upper-income suburbs.
Although Ohio DEW releases the school district report cards every fall with lots of hoopla as a kind of race with clear winners and losers, the causes of disparities in standardized test scores from school to school and district to district are far more complicated. Aggregate standardized test scores for any school or any school district are primarily shaped by one set of variables that are rarely named: family income and the overall income of the community. The standardized test score ranking is, in reality, a measure of economic privilege.
For years now, Rich Exner, the Plain Dealer’s data wonk, has followed up the state’s release of the state report cards with a far more nuanced analysis. In 2019, Exner presented a set of bar graphs demonstrating the following: “The latest set of Ohio school report cards not only provided a scorecard for each district statewide – they once again drove home the point that wealthier districts do better on such reports… To get an idea of how closely report card grades from the Ohio Department of Education follow demographic factors, cleveland.com (The Plain Dealer) compared those grades to U.S. Census Bureau community data for household income, child poverty and the education level of the adults. In nearly every key report card category, the trends followed census data closely.” I include one of Exner’s 2019 bar graphs depicting the correlation of Ohio state school report card rankings with family income.
Again last year, in 2025, when Ohio released the state school report cards, Exner reported the same pattern. While he notes a tiny number of encouraging exceptions when impoverished school districts made impressive test score gains, Exner explains: “For probably as long as the state has been issuing school report cards, one trend has held true – wealthier districts score better. Take this year when the richest 14 districts in the state based on the income of their residents all scored the highest available overall grade – five stars – on the new report cards.” And he explains further: “Income, of course, is not the only measure tied to the trends. Where incomes are higher, this often increases the likelihood that parents in the districts have college degrees, or the existence of two-parent households, with two incomes. And there are other factors that raise challenges for individual school districts.”
Decades of Research Confirm the Trend Exner Identifies
The late professor of education and former president of the American Educational Research Association (AERA) and the Division of Educational Psychology at the American Psychological Association (APA), David Berliner explained: “The big problems of American education are not in America’s schools… It’s neither this nations’ teachers nor its curriculum that impede the achievement of our children. The roots of America’s educational problems are in the numbers of Americans who live in poverty. America’s educational problems are predominantly in the numbers of kids and their families who are homeless; whose families have no access to Medicaid or other medical services. These are often families to whom low-birth-weight babies are frequently born, leading to many more children needing special education.”
In Ohio, Douglas Downey, a professor of sociology at The Ohio State University describes academic research showing that evaluating public schools based on standardized test scores is unfair to educators and misleading to the public. In a 2019 book, How Schools Really Matter: Why Our Assumption about Schools and Inequality Is Mostly Wrong, Downey explains: “It turns out that gaps in skills between advantaged and disadvantaged children are largely formed prior to kindergarten entry and then do not grow appreciably when children are in school.” (How Schools Really Matter, p. 9) “Much of the ‘action’ of inequality therefore occurs very early in life… In addition to the fact that achievement gaps are primarily formed in early childhood, there is another reason to believe that schools are not as responsible for inequality as many think. It turns out that when children are in school during the nine-month academic year, achievement gaps are rather stable. Indeed, sometimes we even observe that socioeconomic gaps grow more slowly during school periods than during summers.” (How Schools Really Matter, p. 28)
In 2017, Katherine Michelmore of Syracuse University and Susan Dynarski of the University of Michigan studied data from Michigan to identify the role of economic disadvantage in achievement gaps as measured by test scores: “We use administrative data from Michigan to develop a… detailed measure of economic disadvantage… Children who spend all of their school years eligible for subsidized meals have the lowest scores, whereas those who are never eligible have the highest. In eighth grade, the score gap between these two groups is nearly a standard deviation.” “Sixty percent of Michigan’s eighth graders were eligible for subsidized lunch at least once during their time in public schools. But just a quarter of these children (14% of all eighth graders) were economically disadvantaged in every year between kindergarten and eighth grade… Ninety percent of the test score gap we observe in eighth grade between the persistently disadvantaged and the never disadvantaged is present by third grade.”
In 2011, Stanford University educational sociologist, Sean Reardon reported on growing residential segregation by income—which correlates with segregation by race. Reardon used a massive data set to document the consequences of widening economic inequality for children’s outcomes at school. Reardon showed that while in 1970, only 15 percent of families lived in neighborhoods classified as affluent or poor, by 2007, 31 percent of families lived in such neighborhoods. By 2007, fewer families across America lived in mixed income communities. Reardon also demonstratedthat along with growing residential inequality and residential segregation by income is a simultaneous jump in an income-inequality school test score gap. The gap between the children with income in the top ten percent and the children with income in the bottom ten percent, was 30-40 percent wider among children born in 2001 than those born in 1975, and twice as large as the black-white test score gap.
Then in 2016, Reardon documented: “The socioeconomic profile of a district is a powerful predictor of the average test score performance of students in that district.” “The most and least socioeconomically advantaged districts have average performance levels more than four grade levels apart. Average test scores of black students are, on average, roughly two grade levels lower than those of white students in the same district; the Hispanic-white difference is roughly one-and-a-half grade levels. Achievement gaps are larger in districts where black and Hispanic students attend higher poverty schools than their white peers… and where large racial/ethnic gaps exist in parents’ educational attainment. The size of the gaps has little or no association with average class size, a district’s per capita student spending or charter school enrollment.”
In 2022, Reardon commented on the factors that contribute to opportunity gaps: “We examine… test score gaps because they reflect… differences in access to educational opportunities. By ‘educational opportunities,’ we mean all experiences in a child’s life, from birth onward, that provide opportunities for her to learn, including experiences in children’s homes, child care settings, neighborhoods, peer groups, and their schools. This implies that test score gaps may result from unequal opportunities either in or out of school; they are not necessarily the result of differences in school quality, resources, or experience. Moreover, in saying that test score gaps reflect differences in opportunities, we also mean that they are not the result of innate group differences in cognitive skills or other genetic endowments… (D)ifferences in average scores should be understood as reflecting opportunity gaps….”
When standardized test scores are aggregated and compared from school district to school district, the disparities reflect economic inequality as well as economic segregation across U.S. school districts. Although in a smaller town a school district’s aggregate test scores may reflect the economic range of a diverse community, in any metropolitan area, some schools are filled with rich kids, while others are filled with poor kids. And more important, test scores do not present any picture of what is happening in anybody’s schools. They don’t tell us anything about the richness of the curriculum or the extracurricular offerings for enrichment. They don’t tell us anything about how teachers work with students or whether students come to love learning.
The family of Tierra Walker, 37, is suing Texas Attorney General Ken Paxton because of her death. Walker died in December 2024 after she was denied an abortion that would have saved her life.
Paxton is running for the U.S. Senate against Democrat James Talarico.
The family’s lawsuit contends that the state’s near-total ban on abortion is unconstitutional.
Walker was 20 weeks pregnant. She had been diagnosed with pre-eclampsia. Her high blood pressure threatened her life.
Walker repeatedly suffered seizures and blood clots. She and her family asked for a life-saving abortion but were rejected by multiple doctors, who refused to treat her because of Texas’s harsh ban on abortions. Doctors who perform abortions will not only lose their license, they may be fined $100,000 and sentenced to life in prison.
The family is also suing the executive director of the Texas Medical Board, the University of Texas health system and individual doctors.
ProPublica reviewed Tierra Walker’s files in 2025, and at best, she was the victim of state-sanctioned malpractice. Under Texas law, the life of the fetus is protected; the life of the mother is not.
ProPublica condensed more than 6,500 pages of Walker’s medical records into a summary of her care with the guidance of two high-risk pregnancy specialists. More than a dozen OB-GYNs reviewed the case for ProPublica and said that since Walker had persistently high blood pressure, it would have been standard medical practice to advise her of the serious risks of her pregnancy early on, to revisit the conversation as new complications emerged and to offer termination at any point if she wanted it. Some described her condition as a “ticking time bomb.” Had Walker ended her pregnancy, every expert believed, she would not have died.
Many said that her case illustrated why they think all patients need the freedom to choose how much risk they are willing to take during pregnancy. Walker expressed that she didn’t want to take that risk, her family says. She had a vibrant life, a husband and son whom she loved.
Under Texas’ abortion law, though, that didn’t matter….
Dr. Elizabeth Langen, a maternal-fetal medicine specialist in Michigan who reviewed Walker’s case, said a physician comfortable with high-risk pregnancies should have counseled her on the dangers of continuing and offered her an abortion. “The safest thing for her was to terminate this pregnancy, that’s for sure.”
During Walker’s many hospital and prenatal visits, 21 OB-GYNs were among the more than 90 physicians involved in her care. None of them counseled her on the option — or the health benefits — of a termination, according to medical records.
ProPublica points out that legislators in several states who have tried to introduce medical exemptions to their anti-abortion laws have been stopped by activists who claim that any exemption is unacceptable. They say that women will seek abortions under false pretenses and that doctors will prescribe abortion for women with nothing more than a headache.
They should talk to Tierra Walker’s family or at least read the ProPublica article.
RFK Jr. has said that there is a link between circumcision and autism but a new study says he is wrong.
Medpage reported:
A study of U.S. children found no evidence linking neonatal male circumcision with autism spectrum disorder, prospective data from the ECHO cohort showed.
Among nearly 2,800 boys in 14 ECHO sites, 6% of those who were circumcised had autism compared with 9% of uncircumcised males, according to Monica McGrath, ScD, MHS, of the Johns Hopkins Bloomberg School of Public Health in Baltimore, and co-authors.
After adjusting for confounders, circumcision was not associated with an autism diagnosis (OR 0.83, 95% CI 0.59-1.17), McGrath and colleagues reported in JAMA Pediatricsopens in a new tab or window.
Stratifying data by region, preterm birth, and neonatal intensive care unit (NICU) admission yielded either an inverse or no association. Circumcision also was not associated with autism-related traits or behaviors.
Only 4% of circumcised boys received acetaminophen (Tylenol) during the procedure and 7% had acetaminophen in the 30 days after birth, the researchers said. Most infants received nerve blocks (72%), oral glucose/sucrose (59%), or anesthetic cream (12%).
“These findings may provide reassurance for families who are considering or have elected circumcision for their son,” McGrath told MedPage Today.
In September 2025, Health Secretary Robert F. Kennedy Jr. claimedopens in a new tab or window that circumcised boys were twice as likely to develop autism as those not circumcised because they were given acetaminophen. The remarks came weeks after the White House warned pregnant women not to take acetaminophen over an unproven link with autism.
“We started hearing from friends, family, and colleagues in the fall of 2025 after media coverage of administration comments about a possible male circumcision-autism connection that referenced studies that were published over a decade ago,” McGrath said. “We knew the ECHO cohort had relevant data to help investigate this question.”
About half of newborn males in the U.S.are circumcised in the hospital within 28 days, but analyses of autism risk in circumcised boys are scarce. “There have been two poorly conducted studies that suggest a connection between circumcision and autism,” observed David Mandell, ScD, of the University of Pennsylvania Perelman School of Medicine in Philadelphia, who wasn’t involved with the research.
Dr. Paul Offit is a pediatrician and director of the Vaccine Education Center at the Children’s Hospital of Philadelphia. In this interview, published by Medpages, he explains why Trump’s vaccine recommendations are crazy.
Offit: What Donald Trump said made about as much sense as when he said we all should drink bleach and expose ourselves to UV light to treat COVID. Maybe he’s not the guy to go to, to get the best medical information.
Trump: Effective immediately, my administration’s recognizing gold-standard childhood vaccine recommendations for only 11 core vaccinations against the most serious and dangerous diseases, along with the MMR [measles, mumps, and rubella], which hopefully will be split up. You have the MMR, we want it in three separate vaccinations given at separate times. Together there could be a possibility they’re quite lethal and separately it looks like they are not at all lethal, but just very effective. So the MMR, we want to have separate — separate visits, separate times. The vaccine being broken into three separate single doses and vaccines being administered in separate visits.
Offit: So, here’s where this all comes from. In 1998, Andrew Wakefield, a British researcher, published a paper in the journal The Lancet of eight children who had received the combination measles, mumps, rubella vaccine, and then within a month supposedly developed signs and symptoms of autism. Now, that paper was ultimately retracted.
Nonetheless, the day after he published that paper, Andrew Wakefield held a press conference and he said, “I think this vaccine should be separated into its three component parts to lessen the risk of autism.” And so when I was on the Advisory Committee for Immunization Practices between 1998 and 2003, we were asked to vote on whether or not this vaccine should be separated into its three component parts, which made no sense. I mean, if the vaccine doesn’t cause autism, then separating it into its three component parts won’t make it less likely to cause autism. We were forced to basically have that vote and we all unanimously voted no.
So, the first measles vaccine came into existence in the United States in 1963, the last best measles vaccine in ’68. The mumps vaccine came into existence in 1967, the first rubella vaccine in 1969. Those three vaccines were combined in 1971 and have been used safely for the last 50 years. We have an enormous amount of information showing that those single vaccines when given singly are no safer and no less effective than when you give the vaccine as a combination.
So the combination vaccine is safe, it’s effective, and it means children get two shots instead of six. This is an administration that constantly talks about giving fewer shots and then makes a recommendation to give more shots.
Trump: And I saw this early on and I’ve seen proof of it where they have a vaccination that looks like the size of a bottle of soda poured into a little child’s body.
Offit: Would love to see the proof that President Trump has of a bottle of soda being poured into a little child’s body. The standard dose of vaccine for children is 0.5 mL. That’s roughly a 10th of a teaspoon. If you look at a multi-dose vial, which would contain say 10 doses, that would be one teaspoon of fluid. A soda bottle contains about 2,000 mL, or said another way, it contains 4,000 doses of vaccine. What is he talking about?
I think the most amazing aspect of that particular press conference is that the media who was standing there listening to him didn’t all burst out laughing. It’s just a ridiculous thing to say. And if he says he has proof of it, great. Let’s see that proof.
Trump: Very importantly, vaccinations to hepatitis B, COVID-19, and influenza, among others, are no longer recommended for all children.
Offit: So, in January, beginning of January of 2026, Robert F. Kennedy Jr. put out a schedule, which was a made-up schedule that was ultimately defeated by a federal court action in March of 2026. But in that schedule, RFK Jr. said that there were three vaccines that basically are optional, shared clinical decision-making. You could choose to get them or not choose to get them reasonably. And those were the influenza vaccine, the SARS-CoV-2 or COVID vaccine, and the rotavirus vaccine.
Now there was another category, the so-called high-risk vaccine category, which President Trump alluded to there, which included the hepatitis A vaccine, the hepatitis B vaccine, RSV, the respiratory syncytial virus, as a monoclonal antibody, and the meningococcal vaccines. Well, everyone is susceptible. I mean, there are arguably some high-risk groups, but everyone is susceptible to those diseases. That’s why everyone is routinely recommended to receive them.
A choice not to get those diseases is a choice to put your child at risk. That’s why they’re routinely recommended. I mean, who’s at high risk for hepatitis A? Anybody who ever eats at a restaurant. The notion that there’s a high-risk group is just absurd. In 1991, we, the United States, recommended a universal hepatitis B vaccine for every child born in this country. At the time in 1991, there were roughly 16,000 cases of hepatitis B in children less than 10 years of age.
This is an AIDS virus. This is a virus that can be transmitted relatively casually because it’s a virus that lives on surfaces for up to 7 days. So sharing towels, sharing washcloths, sharing toothbrushes, sharing razor blades, can put a child at risk of hepatitis B. Those other 8,000 children less than 10 who got hepatitis B from places other than their mother weren’t getting it because they were intravenous drug users. They weren’t getting it because they were sex workers. They were getting it because chronic hepatitis B infections are common in this country and it’s easy to come in contact with someone who could infect you.
Now, if you’re infected in the first year of life, if you’re infected while traveling through the birth canal of a mother who is infected, then you have a 90% chance of going on to develop cirrhosis or liver cancer.
So we dramatically decreased the incidence of hepatitis B in children less than 10, virtually eliminating it because of that recommendation more than 30 years ago. Donald Trump and Robert F. Kennedy Jr. want to loosen the reins there to once again let hepatitis B back into a situation where it can cause cirrhosis, meaning chronic liver disease or liver cancers. It’s an incredibly unconscionable thing to do.
Trump: Decades ago, children received only a small fraction of the vaccines required today in those times. People were much healthy and of course the high rates of autism now observed did not exist.
Offit: So, those were not the glory times. I’m not sure what he’s talking about when he’s saying that the incidence of autism has increased because of an increase in vaccines when that’s not true. The reason that the diagnosis of autism has increased is, most importantly, we’ve changed the definition. It’s now autism spectrum disorder, which includes a much wider spectrum of children. Two, we have better diagnostic tests.
It’s at least 80% genetic. Not all of it is heritable genetics. There are de novo or spontaneous mutations. There are factors associated with maternal health, with maternal infections during pregnancy, with maternal drugs taken during pregnancy that increase the risk of autism. But you don’t hear about any of that because people like Robert F. Kennedy Jr. and President Donald Trump have taken the autism story hostage to support their own false beliefs — false, immutable, science-resistant beliefs — that vaccines are the cause.
That is the single best studied environmental influence on autism and it’s not it. So why are we still spending money on this fruitless dead-end hypothesis? We could be spending money on far more promising leads. By doing what RFK Jr. and President Trump are doing, by taking autism hostage for their own anti-vaccine efforts, all they’re doing is hurting children with autism.
After the executive order came out, the sun came up the next day. Parents took their children to the pediatrician’s office. Pediatricians gave them their vaccines according to a schedule, the recommended childhood schedule that is science-based. And the sun came up the next day and the next day after that. I think that this will largely be ignored. I think that state health departments and governors in states are largely going to ignore this. And we can then move past this in much the same way we move past President Trump’s recommendation to drink bleach to try and treat your COVID.
Let’s begin by stating a simple fact: Donald Trump is not a doctor. As a matter of fact, he has no credentials as a scientist or a researcher. Neither does Robert F. Kennedy Jr,, who is Secretary of the Department of Health and Human Services. RFK Jr. is in charge of the nation’s enormous public health agency; states and localities look to HHS for guidance to protect people against risks to their well-being.
It’s hard to imagine a worse choice for Secretary of HHS. For years, he has been a critic of vaccines; he believes that there is a link between vaccines and autism, but mainstream scientists don’t agree with him.
During the pandemic, the number of parents who were resistant to vaccines increased, and they look to RFK Jr. as their leader.
Measles is surging. As of August 2026, the Centers for Disease Control and Prevention (CDC) has confirmed 2,465 measles cases across the United States for the year 2026, already surpassing the 2,289 total cases reported for the entirety of 2025. 93% of those who got measles were unvaccinated.
Children will get sick. Some may die because of the bad advice these unqualified men give.
The tsunami of fabricated claims in the order and voiced by Trump and others at the Oval Office announcement Monday is almost overwhelming.
If there’s a saving grace in this episode, it’s that most states and the vast majority of parents are likely to ignore Trump’s order. But the order will leave its mark by magnifying the confusion many parents already face in making decisions about their children’s immunizations. That’s a public health threat all on its own.
Here’s a look at Monday’s order, which claims to “deliver gold standard childhood vaccine recommendations.”
First, the order pares the list of recommended immunizations to 11 diseases from 17. Six immunizations — for hepatitis A and B, rotavirus, meningococcal disease, flu and COVID-19 — are knocked down from “recommended” to “shared clinical decision-making.” That’s code for expanding the opportunity for parents to refuse the shots for their children.
Trump calls for supplanting the combined measles, mumps and rubella vaccine by individual vaccines for each disease, administered at separate physician visits.
He calls on the Department of Justice to pursue cases against states and localities whose immunization rules contradict “parental authority, religious freedom, disability accommodations, and equal protection under the law, including their obligations to provide religious and medical exemptions from childhood and adolescent immunization requirements.”
He revived the canard about vaccines contributing to a rise in autism, despite the connection having been thoroughly refuted by years of clinical research.
Trump also called on the Centers for Disease Control and Prevention, under whose imprimatur federal vaccine recommendations are issued, to revise its recommendations to match those of other “peer, developed countries.”
That last item points to Trump’s disregard for the niceties of government procedure. In effect, he has presented his newly installed director of the CDC, Erica Schwartz, with a heaping, steaming platter of policy manure. Schwartz only won Senate confirmation on Wednesday, after a hearing in which she pledged to “never betray the science” on which CDC policies are based. This is her first test.
Schwartz hasn’t commented on the Trump order as of this writing. I asked the CDC for her view on the executive order, but received no reply.
Trump unveiled his executive order at an Oval Office ceremony at which no licensed physician was in attendance. Trump himself issued mouthfuls of balderdash during the event. “I’ve seen proof,” he said, “where they have a vaccination that looks like the size of a bottle of soda, poured into a little child’s body, and bad things happen.”
Let’s be crystal clear: There’s no such thing. To quote infectious disease expert Jake Scott of Stanford Medicine, “every vaccine given at a baby’s two-month visit adds up to about half a teaspoon. A 20-ounce soda bottle is more than 200 times that.”
At Monday’s announcement, Trump called the MMR vaccine “quite lethal.” Asked by a reporter what evidence he had for that, he replied, “What I’ve heard is that there are some people that say it is that way.”
Trump’s order cites no scientific research to justify splitting multivalent vaccines such as the MMR into individual parts, even though it’s obvious that doing so and requiring multiple doctor visits will raise the cost and time-wastage for many households and despite research showing that the bundled vaccines don’t present a health threat to children and work as expected.
I asked the White House for the scientific grounds for splitting up the vaccine. “President Trump is one of countless parents who have voiced questions and concerns about the combined MMR vaccine,” said White House spokesperson Kush Desai. “The Administration’s push to develop separate vaccinations for all three diseases … ultimately will increase vaccination rates for all three diseases.”
In fact, experts generally hold that splitting the shots will decrease vaccination rates for all three diseases by erecting an unnecessary obstacle to the shots. That was Japan’s experience when it split off mumps from the MMR vaccine and ended up with a higher incidence of mumps than before.
Physicians oppose a return to monovalent vaccines because that would “unnecessarily delay administration of the three vaccine components, leaving children susceptible for a longer period of time to serious, life-threatening diseases,” according to the American Academy of Pediatrics. “Use of monovalent vaccines also would increase the number of injections a child would need and increase the number of visits required to complete the vaccination series.”
In other words, the bundled vaccines are better for children’s health.
Developing separate measles, mumps and rubella vaccines and bringing them to market could take a decade of R&D including clinical trials. Drugmakers aren’t likely to embark on the process now, knowing that a new administration will take office Jan. 20, 2029, and — assuming it hews to accepted science — likely as not will reverse these recommendations.
Also, vaccine policy is firmly in the hands of the states. None are mandated to follow federal standards. To date, almost all states have maintained their previous mandates or otherwise decoupled their policies from the federal recommendations. According to the healthcare information site KFF, by Jan. 20 this year, 28 states and the District of Columbia — including all states with Democratic governors — had announced that they wouldn’t follow the federal government.
Trump’s latest order is an attempted end run around a federal judge’s ruling in March that blocked Kennedy’s attempt to cut the vaccine schedule to 11 immunizations. Trump followed that ruling with the executive order citing peer countries May 29.
Vaccine specialists find Trump’s citing “peer nations” to be “nonsensical,” to quote Paul Offit, one of the nation’s leading vaccinologists, of Children’s Hospital of Philadelphia. When if comes to child immunizations, Offit has observed, there are no “peers” to emulate: “Different developed world countries make different decisions based on demographics, health system capacity, vaccine access, and vaccine cost,” Offit notes.
For example, Denmark, which Kennedy has held up as a model, doesn’t pay for the rotavirus vaccine, “which prevents a virus that causes vomiting, diarrhea, and severe dehydration,” Offit says. But it has been recommended in the U.S. since 2006, eliminating as many as 70,000 hospitalizations every year.
“Denmark should mimic the U.S., not the other way around,” Offit says.
The bottom line is that childhood immunizations save lives. The advent of the measles vaccine reduced the incidence of that disease in the U.S. from an average of 530,000 cases per year to fewer than 50. Cases of whooping cough, polio, smallpox, rubella and diphtheria fell by 99-100% after vaccinations for each became standard.
Trump and Kennedy want to return us to those bad old days by refashioning them fictitiously as the good old days. They would expose millions of children to severe disease and death, which that could be averted by the science at hand. It’s a terrifying turn in American medical policy. In heaven’s name, why would they want to do it?
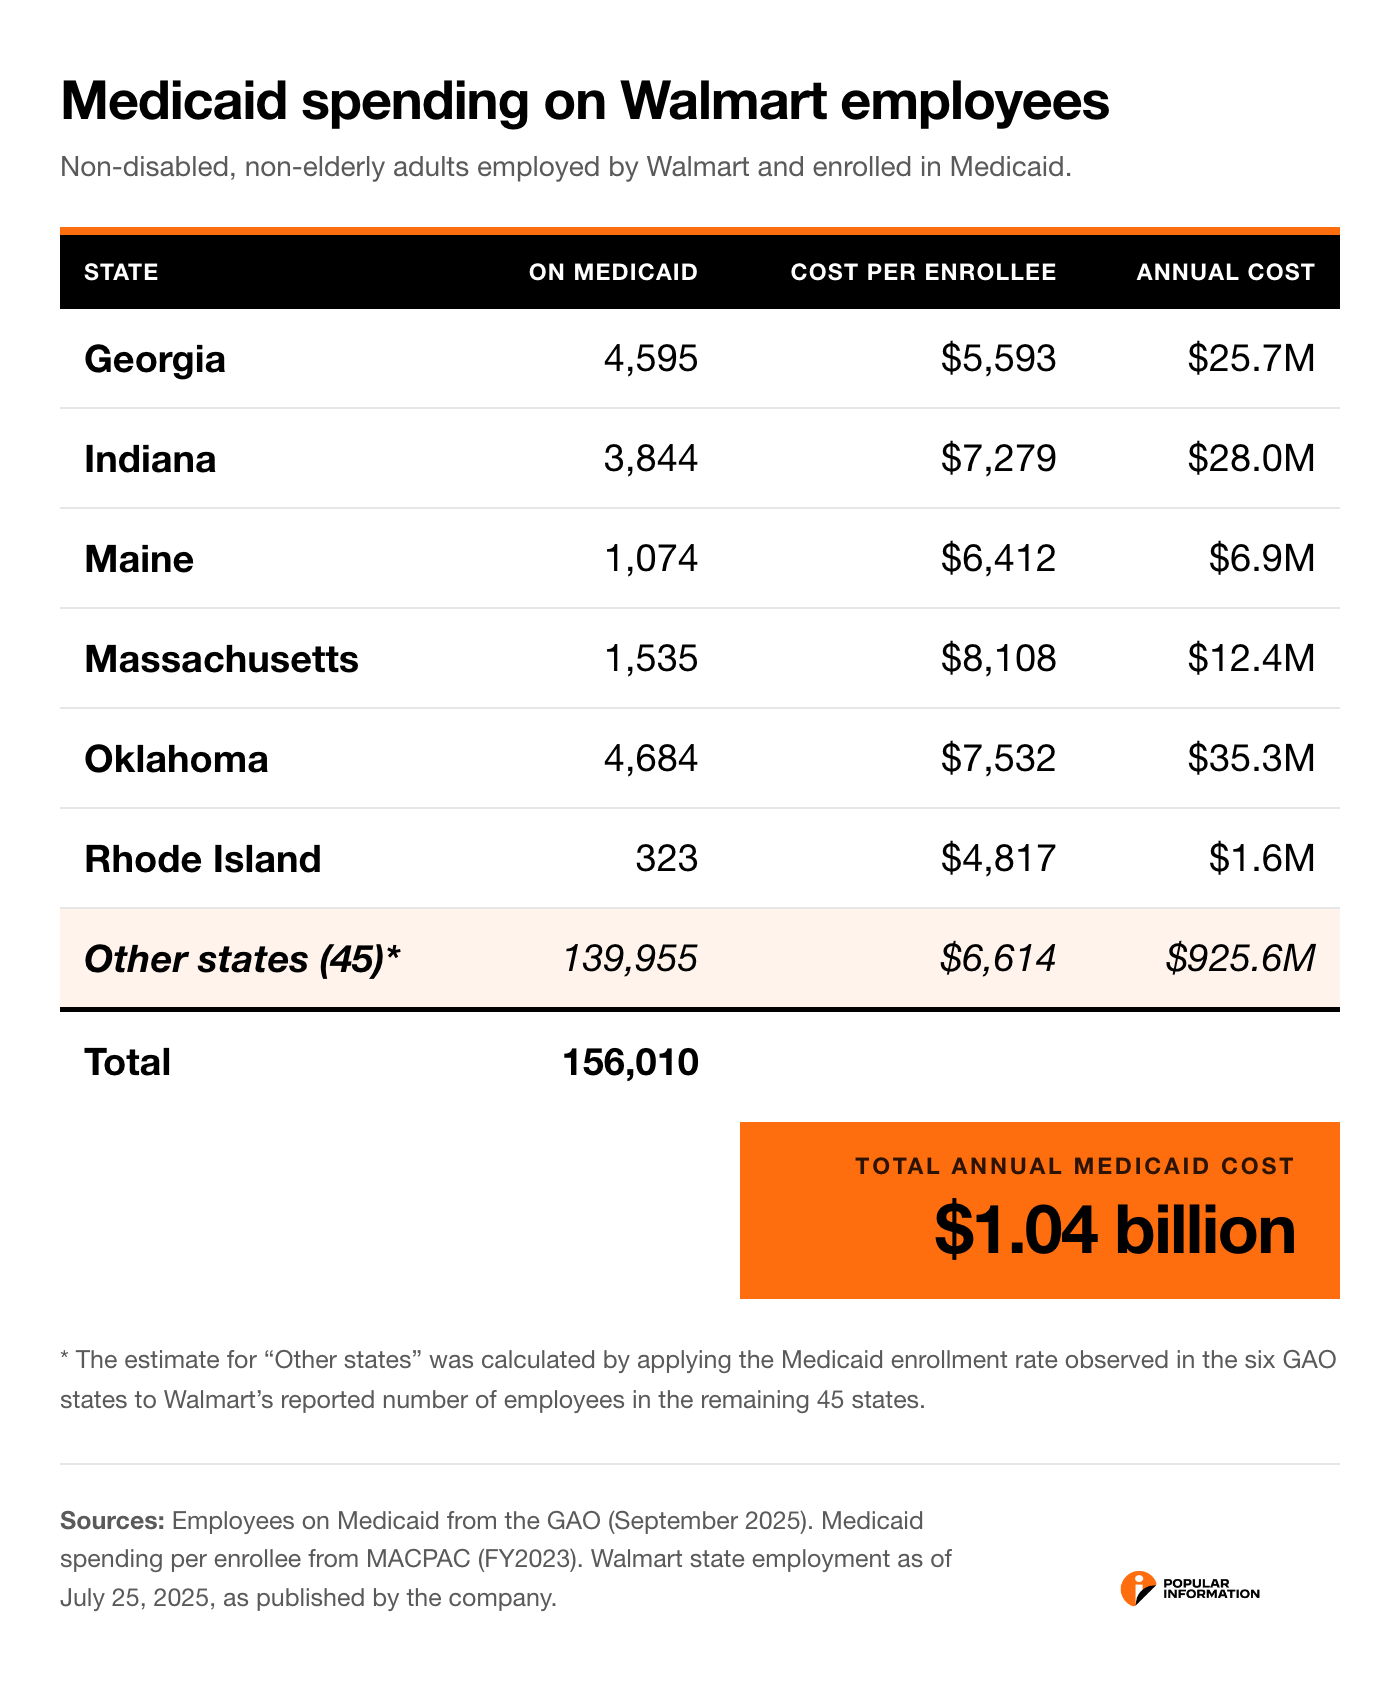
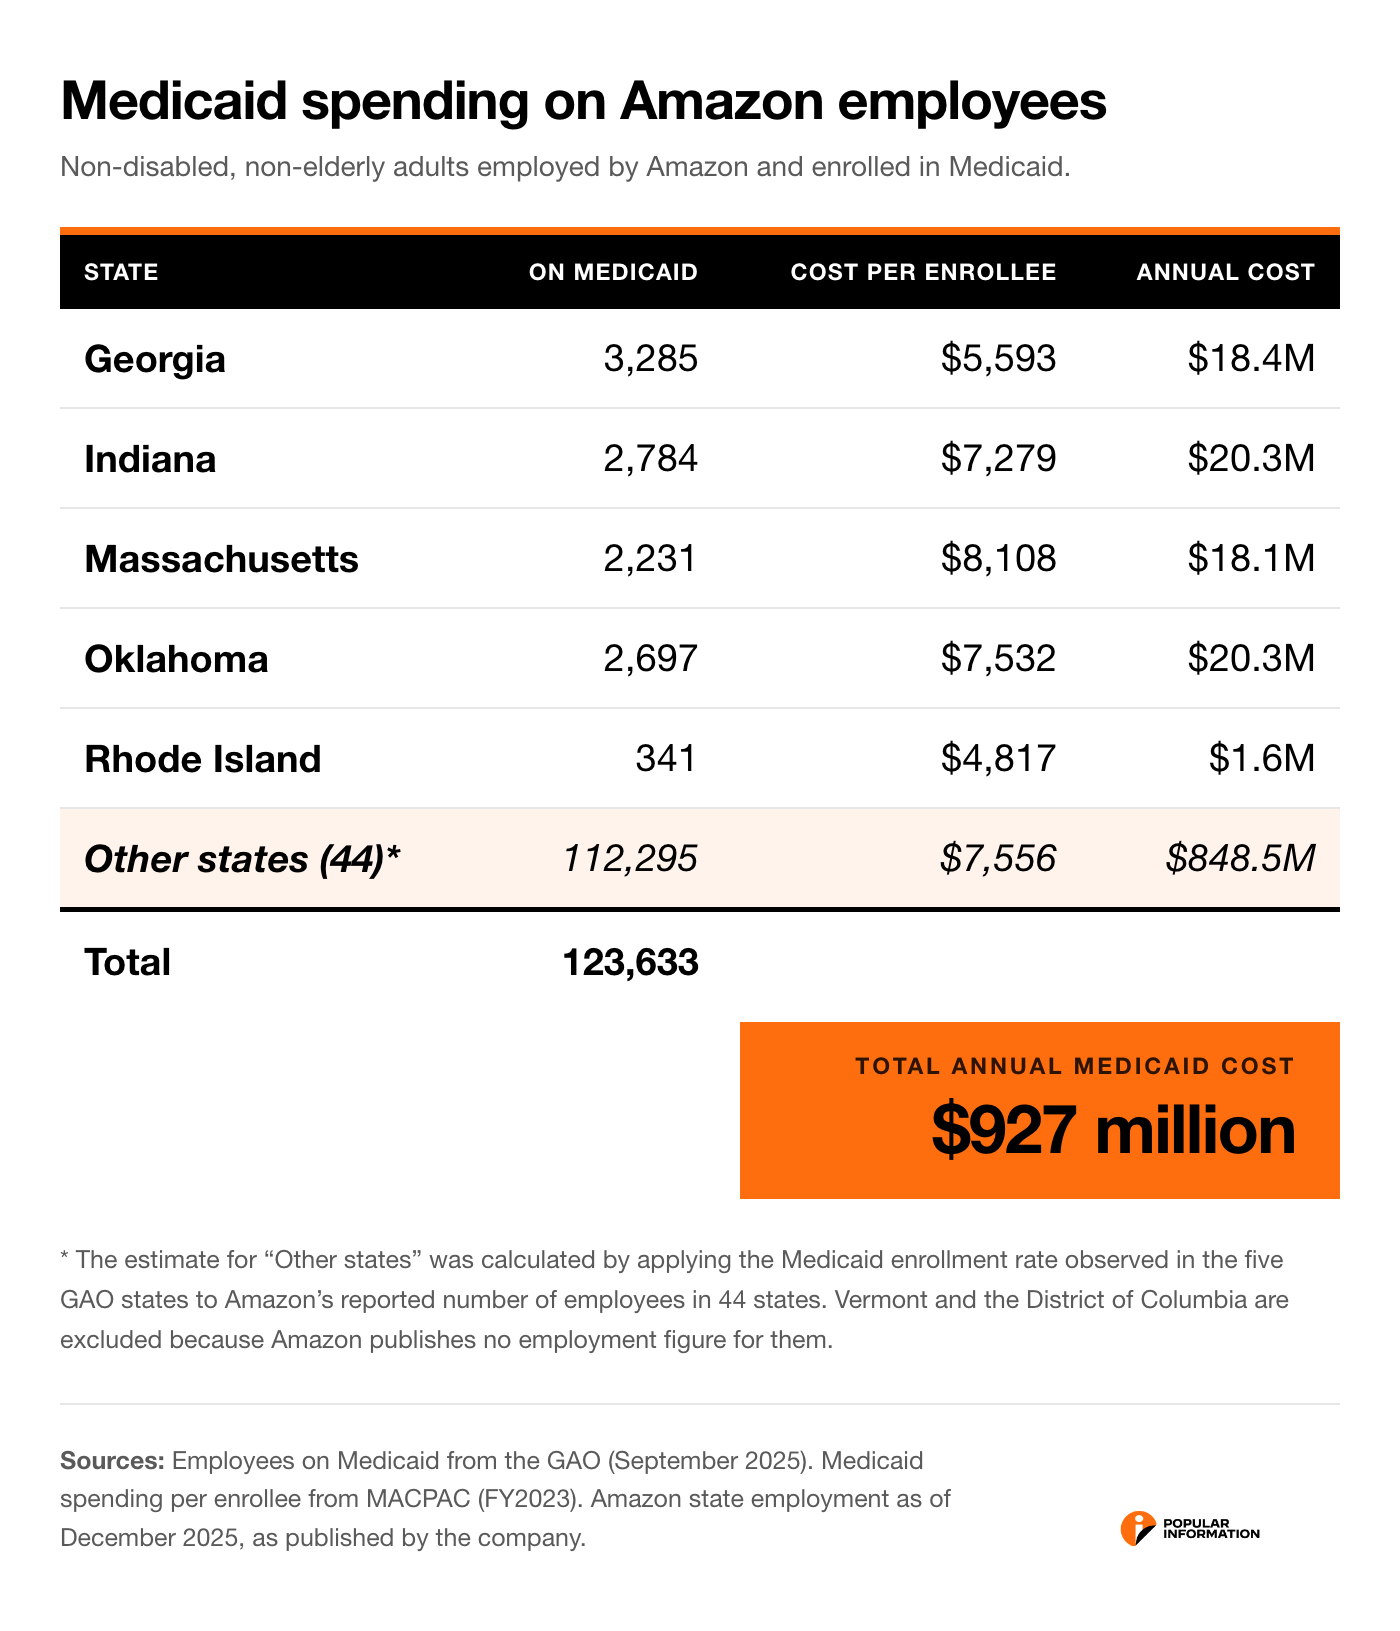
Judd Legum at Popular Information excels at exposing scandals, many of which are in plain view. In this post, he reveals what many people have long suspected: About 10% of the employees at Walmart and Amazon qualify for public subsidies for Medicaid because they are so poorly paid. Meanwhile, the owners of Walmart and Amazon are multi-billionaires. Why don’t they pay wages that are enough to keep their employees off public subsidies?
Judd writes:
American taxpayers are spending billions every year providing Medicaid benefits to hundreds of thousands of employees of Amazon and Walmart, a new analysis by Popular Information reveals.
Amazon and Walmart are two of the largest and most profitable companies in the country — collectivelygenerating $100 billion in profits in 2025 — but many of their employees still qualify for Medicaid because their take-home pay hovers around (or below) the poverty line.
As taxpayers keep their workers afloat, the wealth of the two companies’ largest shareholders is increasing exponentially. The Walton family, the largest shareholders of Walmart, saw their collective wealth increase from $238 billion in 2021 to $513 billion at the end of 2025. Meanwhile, Amazon founder and current executive chairman Jeff Bezos saw his net worth increase from $187 billion to $255 billion over roughly the same time period.
Popular Information calculated the public subsidy to Amazon and Walmart by cross-referencing several publicly available data sources. Last week, the Government Accountability Office (GAO) released a report examining the top 25 employers of Medicaid enrollees in six states: Georgia, Indiana, Maine, Massachusetts, Oklahoma, and Rhode Island. This provided state-level Medicaid enrollment for Amazon and Walmart workers in all six states, with the exception of Amazon in Maine.
Popular Information compared these figures to the total number of employees working for Walmart and Amazon in each state, sourced from company disclosures, to establish an average Medicaid enrollment rate for each company. The average Medicaid enrollment rate was then used to establish an estimated Medicaid enrollment for employees of each company in the remaining states.
Finally, the estimated number of employees receiving Medicaid in each state was multiplied by that state’s average annual cost of a non-elderly, non-disabled Medicaid enrollee, as published by the Medicaid and CHIP Payment and Access Commission (MACPAC).
Using this methodology, Popular Information estimates that, nationwide, over 156,000 Walmart employees are enrolled in Medicaid at an annual cost to taxpayers of approximately $1.04 billion.
This figure significantly understates the true cost of Medicaid for Walmart employees to taxpayers. First, the calculation only includes the direct cost of Medicaid for the employees themselves. But Walmart’s low wages for these employees also makes their families eligible for Medicaid. Taking into account dependents, the cost to taxpayers would roughly double. Further, the most recent data on Medicaid cost per enrollee from MACPAC is from fiscal year 2023. Costs for 2025 and 2026 are likely significantly higher.
In Walmart’s 2026 fiscal year, then-CEO Doug McMillon was paid over $29.2 million in total compensation while the median Walmart worker earned $30,520 — a ratio of 958 to 1. The earnings of an average worker put them well below the cutoff for Medicaid eligibility for a family of three.
For Amazon, the same methodology finds that an estimated 123,000 Amazon employees are enrolled in Medicaid at a cost to taxpayers of $927 million.
Amazon CEO Andy Jassy was given a massive compensation package of $212 million in 2021, mostly in stock that vests over 10 years. Jassy’s compensation has been smaller since; he was paid another $2.1 million in 2024. Meanwhile, the median Amazon employee earned $40,206 that year. This global number includes the many higher-paid technical employees who work at Amazon. Warehouse workers in the United States, and others in blue collar positions, make much less, making them eligible for Medicaid.
“Amazon is one of the largest job creators in the country, so looking at raw numbers instead of percentages is misleading,” an Amazon spokesman said in response to Popular Information’s request for comment. “Also, eligibility for both SNAP and Medicaid is based on total household income and family size, not individual wages or benefits – so employers that offer part-time options for those who want them, like we do, are likely to have more people who are eligible.”
While Walmart ranked first in terms of “raw numbers” of employees on Medicaid, Amazon had a higher percentage of its workforce on Medicaid (11.7%) than Walmart (9.4%).
Not everyone who works parttime does so by choice. In June 2026, 4.7 million “individuals would have preferred full-time employment but were working part time because their hours had been reduced or they were unable to find full-time jobs,” according to the Bureau of Labor Statistics. Moreover, according to the GAO, 66.1% of employed individuals on Medicaid work full-time.
Walmart declined to comment on the record. According to the company’s corporate website, starting wages at Walmart have increased by 93% since 2015.
Acting Attorney General Todd Blanche went mask-off last week, promising behind closed doors to roll back abortion access even further, and telling religious pro-life hard-liners that he wanted the Supreme Court’s 2022 Dobbs v. Jackson Women’s Health Organization decision overturning the right to abortion to become “permanent in every single state.”
Blanche made the comments in a “prayer call” last Thursday hosted by the White House Faith Office and attended by various faith leaders. The call was not open to press and not on the record, although the entirety of the call is now up on YouTube.
“We don’t have complete victory yet, but we will have victory, and victory will be soon, and it will be permanent,” Blanche said. “If states have said, ‘We are going to protect the unborn and we’re going to protect every life from the moment of conception,’ we’re putting practices and policies in place so that other states and other organizations can’t attack that.”
“They can’t do things like they’re doing with mailing in mail-order drugs,” Blanche added, singling out abortion pills.
This is a far cry from the answer he offered at his confirmation hearing, when he claimed he would “carefully evaluate every lawful action available to ensure the faithful enforcement of the Comstock Act,” the 150-year-old law that bans the mailing of contraceptives and other things considered to be “obscene.”
He also noted that the Trump administration is “putting practices and policies in place” to block abortion pills mifepristone and misoprostol from being sent to states that have banned abortion, a process that would require the Justice Department to invoke the Comstock Act—something President Trump specifically said he wouldn’t do back in 2024 while campaigning.
“A vote to confirm Todd Blanche is a vote ‘so that the Dobbs decision becomes permanent in every single state,’” Senator Patty Murray wrote Tuesday on X. “Those were his own words to anti-abortion extremists. Senators who vote for Blanche are voting for an Attorney General who will attack abortion rights in EVERY state.”
Florida has become a very weird state. There’s hardly a conspiracy theory that Governor Ron DeSantis is not championing, especially when the subject is public health. DeSantis hired Dr. Joseph Ladapo as the state’s surgeon general, putting the lives of Floridians at risk.
Dr. Ladapo doesn’t believe in vaccinations. Disregarding science, he has sought to make all vaccines a matter of choice, not the protection of public health. Thus, no matter what other medical professionals may say, Dr. Ladapo wants to ban all vaccines mandates.
It’s an odd time to take a stand against vaccinations. Florida is experiencing an uptick in measles cases: As July 2026, Florida has reported 154 confirmed measles cases. Florida ranks among the states with the highest measles case counts in the country this year.
Nationally, the CDC reports 2,371 confirmed measles cases in the U.S. so far in 2026—the highest annual total in more than 30 years.
Now Florida’s state attorney general has threatened to withhold public funding from Catholic schools unless they allow their students to opt out of vaccines.
Florida’s attorney general has threatened to pull funding from Catholic schools unless they allow their students to opt out of vaccine requirements.
James Uthmeier, the attorney general, revealed on X that he had sent a letter to the Florida Conference of Catholic Bishops (FCCB) expressing concern that schools within the faith may refuse to grant religious exemptions for vaccinations for the upcoming school year.
The letter, which was sent on July 31, is the latest in a series of pushes by lawmakers to change Florida’s vaccine mandates.
According to Uthmeier, at least one diocese appears to have “embraced” a position raised by the National Catholic Bioethics Center that the schools cannot offer exemptions on religious grounds because the Catholic Church does not teach that use of vaccinations produced in cell lines derived from the tissue of an aborted fetus is “intrinsically evil.”
Uthmeier, a Catholic himself, says that such a position is “concerning” as state law requires public and private schools to offer exemptions if parents have religious objections.
“I therefore urge Catholic schools to comply with Florida law and grant religious exemptions to school vaccine policies,” Uthmeier wrote. “Failure to comply could jeopardize eligibility for state educational scholarship programs.”
The Archdiocese of Miami says that over 95 percent of students attending the city’s Catholic schools are on some kind of state scholarship, according to The Miami Herald. Many receive around $6,500 with which to pay for their tuition.
Uthmeier has demanded an answer to his letter by August 7.
Michele Taylor, a spokesperson for the FCCB, told CBS News that the conference is reviewing the letter and will respond to the attorney general.
“Be assured, Florida’s Catholic schools are operating in accord with the law and Church teaching,” Taylor said.
Under state law, students attending both public and private schools must be vaccinated against diseases including polio, chickenpox and measles. Schools, including Catholic institutions, do permit medical exemptions from vaccines with a valid doctor’s note.
Vaccination mandates have increasingly come under attack in Florida, with Joseph Ladapo, the state’s surgeon general, likening the mandates to “slavery” late last year.
“Who am I to tell you what your child should put in your body?” he said. “I don’t have that right. Your body is a gift from God.”
Ladapo also pledged to end “every last one” of the mandates.
However, experts slammed his claims, with Democratic state Representative Anna Eskamani branding the plans a “public health disaster in the making.”
The Florida Education Association also said that reducing vaccinations puts “children’s health and education at risk.”