This post was written by Charles J. Morris, Emeritus Professor of Psychology at Denison University, who lives in Indianapolis.
Does the ISTEP Measure School Quality and Teacher Effectiveness?
Charles J. Morris1
While there appears to be general agreement that teachers can make a big difference in the lives of students, there is little evidence that performance on standardized tests provides a valid assessment of teacher effectiveness. Nonetheless, at the national, state, and local levels, we are seeing increasing use of test scores to evaluate both schools and teachers, to award merit pay, and even sanction low performing schools and corporations.
This growing trend toward using test scores to evaluate schools and teachers fails to recognize the evidence that factors beyond the control of schools account for most of the variation we see in test scores among school districts throughout a given state. Matthew Di Carlo of the Shanker Institute sums it up this way: “…roughly 60 percent of achievement outcomes is explained by student and family background characteristics…schooling factors explain roughly 20 percent, most of this (10-15 percent) being teacher effects.”2 (The remaining variation is unexplained and considered error variance.) What this basically means is that schools and teachers are being judged to a substantial degree on the basis of factors over which they have little control.
Is the above conclusion also true for the ISTEP, Indiana’s test for measuring student performance and evaluating school quality and teacher effectiveness? The purpose of this short piece is to briefly summarize some evidence which indicates that the same conclusion holds for the ISTEP: Out-of-school factors, namely the socioeconomic profile (SES) of a school district, explain most of the variation we see in test performance from one district to the next.
Consider, for example, the following chart which shows the percent of students who passed both the ELA (English/Language Arts) and Math portions of the 2013 ISTEP as a function of the percentage of students in the corporation (Indiana’s districts) who qualify for free- or reduced-price lunches (FRPL, a commonly used measure of SES):
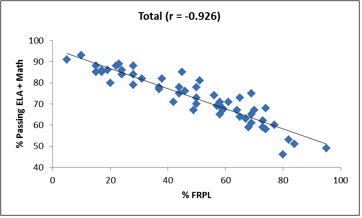
These data are based on the 56 corporations that have at least 5000 students in the district. As can be seen, there is a very strong correlation between the two variables: The higher the percentage of kids who qualify for FRPL, the lower the passing percentage. Another way of putting it is, if we know the socioeconomic profile of a corporation we can make a very good prediction of where that corporation stands compared to other corporations on the ISTEP. This should not be a surprise to those familiar with the research literature. The same relationship has been found for the various standardized tests used throughout the country.
The above results are based on the performance of all students in each corporation. The following charts show the results separately for 3rd and 8th graders:
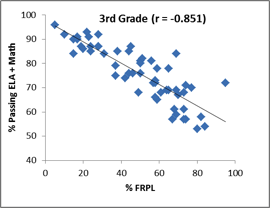
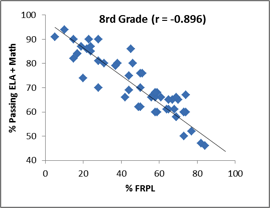
Again, we see the same pattern for both grade levels, basically unchanged after 5 years of schooling in a high-scoring or low-scoring corporation. The SES influence is quite strong independently of the schools and teachers in a particular corporation. In fact, if anything, the SES impact appears to become slightly stronger as students progress from the 3rd to 8th grade.
So what are we to make of this obvious association between ISTEP scores of SES? The seemingly inescapable conclusion is that corporations and teachers deserve neither praise nor criticism for how their student compare to other corporations and teachers. Clearly, the socioeconomic profile (SES) of the corporation plays a decisive role. So I ask a simple question: Does anyone seriously believe that if Carmel and Gary (a high and low-performing corporation, respectively) exchanged teachers, the ISTEP scores would suddenly reverse themselves? I don’t think so.
The challenge thus becomes how to respond to the fact that poorer kids are not performing well in our schools. Is there less parental involvement in these communities? Are expectations lower? Do these parents need additional help in becoming more effective mentors? Are after-school tutoring programs a possible solution? What about summer programs? Or pre-school programs? Perhaps all of the above, along with addressing the well-documented and devastating effects that poverty has on the health and well-being of poor children long before they even enter school3.
But one thing seems clear: Judging school and teacher quality on the basis of test scores offers little in the way of a solution. We need to look beyond our schools and teachers if we are going to better prepare all kids for the world they will face in the days ahead.
1Charles J. Morris is an Emeritus Professor of Psychology from Denison University. He resides in Indianapolis.
2Matthew Di Carlo, Shanker Institute (see http://shankerblog.org/?p=74#more-74)
3Diane Ravitch, Reign of Error (New York: Knopf, 2013, pp. 91-98).


An extraordinarily important piece from Dr. Morris!
LikeLike
I independently produced essentially the same graph using FRL rates for the 64 public schools in Kalamazoo County Michigan. The r squared for the correlation of free/reduced lunch % to the percentile ranking of each school in the Michigan State Department of Education’s “Top-to-Bottom” ranking is .76 Most troubling the graph is the clustering of schools with at least two-thirds of students receiving FRL in the lowest percentiles. Twelve of 21 schools with at least 66% of kids receiving FRL were ranked in the bottom decile. Eighteen of 21 were in the bottom quintile, and all 21 were below the 30th percentile.
Tim Ready
Director
Lewis Walker Institute
Western Michigan University
LikeLike
Professor Morris, it is great that you recognize a major issue in Education. These are well known facts that have been addressed by many Educators, the problem is that no one seems to listen. As an esteemed Professor and concerned citizen it is your duty to address these problems to your legislature and the citizens of your State for the sake of Education and the future of our youth!
LikeLike
This is an important piece of work, confirming many largely ignored studies since the James Coleman Report of 1965.
LikeLike
The deformers are believers in a silver bullet, a magic potion, a philosopher’s stone that can address achievement gaps without addressing the real underlying issue–savage inequalities.
LikeLike
The Achievement Gap is a political weapon, and that is all the so-called reformers care about it. Once it ceases to be useful to them – after all, it’s the basis of their pose in support if civil rights – they will discard it, just as they discard special education students and English Language Learners in charter schools.
Ask them about the Justice Gap, the Wage Gap, the Health Gap, etc. and you’ll see them lose interest immediately.
LikeLike
Dr. Morris, thank you for your insight into the most important, fundamental issue of our time. The focus that you bring to our education system is sorely needed. Education remains our #1 national problem.
LikeLike
Education reform remains our #2 education problem, right after child poverty.
LikeLike
I wonder about this….schooling factors explain roughly 20 percent, most of this (10-15 percent) being teacher effects.”……..roughly? most? effects? A teacher who has a good situation regarding supplies, consistent support in discipline, adequate salary, etc…….you might be able to get agreement about the 60 percent thing, but it seems to me this leaves a lot of room for subjective manipulation using test results……
LikeLike
What do Dr Morris’ charts look like if you drill down and look at the individual student score vs SES within a school or corporation?
Is this a community effect or an individual effect. More to the point, if a child from a SES associated with wealthier corporations goes to a school with a majority FRPL population, what is the effect on that student. The approaches for education reform would seem to depend on this.
LikeLike
That’s a good question. I worked at a high poverty elementary (85-90% free & reduced lunch) in Bloomington, IN. I remember one time we were talking about the 6 the kids who stayed in our building from kindergarten through 6th grade. They were the some of the few who did not qualify for free & reduced lunches. They were very successful students in high school & college.
LikeLike
“Peer group” influence is part of the constellation of out-of-school factors that affect performance, so I would expect some effect on academic motivation and achievement but this may not be revealed on standardized test scores.
LikeLike
They don’t look like anything as all if this talk is of chimeras, duendes, illusions, ghosts, fairies, fantasmas, etc. . . .
I used to think that it was only those who were completely out of touch with reality were the ones that would see and discuss these things! But in the Rheal world. . . . . . .
LikeLike
That 8th grade has a slope of nearly -1. That might indicate an individual-by-individual effect (with some fuzziness of course) at that age.
LikeLike
If this correlation were any tighter, it would be J-Lo’s pants.
LikeLike
lol
LikeLike
This correlation is tighter than Scrooge (and Gates’) wallets regarding taxes and real charity.
LikeLike
Ay, ay, ay!
To simply answer the question: NO, ABSOLUTELY NOT!
And anyone who thinks it does/can, I’ve got some great ocean front property over at Lake of the Ozarks in central Missouri that is going like gang busters. Cheap, cheaper and cheapest!! Don’t miss out on this grand opportunity! Unbelievably historically financing available!
Contact one of my very fine sales associates now!
LikeLike
Jeez, Duane, relax. Correlation does not mean causation. Not one kid is damned failure (or for that matter destined for success) because of these graphs, and at least 5000 kids are represented by each data point. Do you agree that based on this data “poverty” most probably plays a significant role in academic performance?
LikeLike
Interesting work, but it might be overstating the relationship to say that these graphs show SES influence independent of teachers unless high SES and low SES corporations have the same profile of teachers. If high SES corporations are able to attract more experienced or in other ways more talented teachers by offering better working conditions or higher pay, some of the influence of teacher experience might be confused for SES status.
The stronger relationship between SES and scores as students are longer in public schools is very interesting, but might also be tainted by the problem above. Is there a large difference in working conditions and pay between teaching junior high in a high SES and low SES corporations? Might that difference allow the high SES school to choose amoung a variety of sting applicants?
LikeLike
Have you ever looked at the test results from a specific school? When the results are disaggregated for economic status they still follow the same pattern. No variation in working conditions, pay, etc. when the students are in the same classroom.
LikeLike
Here is a link to a school in an affluent suburb of Chicago. It is rated as one of the best districts in the state and it’s teachers are experienced and well paid. 75% of the students are classified as non-low income with the remainder classified as low income. There is huge gap in test scores. http://iirc.niu.edu/School.aspx?source=Trends&source2=ISAT&Schoolid=190222030262005
LikeLike
School level scores are much more persuasive, especially if controlled for individual classrooms and learning disabilities.
Highlands elementary makes an interesting contrast doesn’t it? Perhaps evidence of a peer impact or maybe just small numbers and chance.
LikeLike
TE:
Exactly so. The unit of analysis should be aligned with your key potential explanatory variables otherwise you are simply reducing the variance that you are trying to explain by an averaging process. A school-level analysis would be better, especially since the FRPL data is available at the school level. I also see no reason for cutting the analysis off at districts with at least 5000 students.
LikeLike
I took a quick look at the 2013 ISTEP data and indeed as expected the correlation between %FRPL and % Passing drops significantly when you look at school level data:
Overall Math & ELA % Passing
Corporations (Harris) r = -0.926
School r = -0.634
3rd Grade Math & ELA % Passing
Corporations (Harris) r = -0.851
School r = -0.678
8th Grade Math & ELA % Passing
Corporations (Harris) r = -0.896
School r = -0.614
The % of the variation in passing rates that might be attributable to SES using the FRPL variable is clearly significant but markedly lower than that suggested by Dr. Harris. The drop in the correlation between 3rd and 8th grade is interesting.
All the data can be found in Excel format
http://www.doe.in.gov/accountability/find-school-and-corporation-data-reports
To replicate you will need to construct the %FRPL index and combine data from different tables.
I assume that somebody at the Indiana DOE is doing a more systematic analysis of this data.
LikeLike
teachingeconomist, you bring up an interesting point, but keep in mind that the state of Indiana has decided that if a school is struggling to bring test scores up, they LOSE money that might otherwise help provide the resources that low-SES schools lack. When school funding is cut because of scores, the first issue to suffer is the budget for materials. The second – pay for teachers and teachers’ positions. This makes it harder to attract and retain the best teachers, and that contributes to the problem you address.
So the state uses funding to punish schools who need the most help. It’s the proverbial vicious cycle! And this is why many suspect and vocally claim that school reformers are deliberately widening the gap between the haves and have-nots.
LikeLike
INteachereducator:
That is a helpful additional piece of information. However, what it also suggests is that this variable needs to be factored into Prof. Harris’ model. As it stands, the model is underspecified since there are too many other factors that are likely to be highly correlated with %FRPL that may be more immediate drivers of the Math & ELA pass rate. The economic circumstances of the students is certainly one of them. The fact that there are 20 plus schools that fit the 75-75 category suggests that there is more to look at.
LikeLike
Highlands school is 95% non-low income and it houses the districts gifted and talented program.
LikeLike
I was impressed that every low income student at Highlands scored above the cut score on the math exam in 2012, though less so now that I learn that at least a portion of those students were chosen to go to that school (and chosen to leave the other schools, lowering the other school’s scores) precisely because they do well on exams.
LikeLike
Looking at the school data there are 28 schools that meet an arbitrary 75-75 rule: 75% FRPL and 75% Passed both ELA and Math ISTEP. It would be interesting to see what these schools are doing and the extent to which what they are doing can be replicated.
LikeLike
When I think of the money that has been diverted from classrooms to testing and teacher evaluation companies, it makes me sick. The extra supports (after school programs, counseling, smaller classes, electives, etc.) have been sucked away by corporate greed. This borders on plain stupidity and theft.
LikeLike
Ah yes, but Pearson Publishing is VERY happy with the trend!! They now have exclusive contracts to produce, publish, administer, score and report ALL educational testing in IN… ISTEP, the CASA and CORE tests that teachers must take to get certified, the End-of-Course assessments… everything!
Guess who was a leading campaign donor for Tony Bennett, Mitch Daniels, Mike Pence, and many of the GOP leaders in the General Assembly AND the State Board of Education?? Yep, Pearson! Now you know WHERE all those dollars go and WHY.
Please remember this when you vote in upcoming elections!
LikeLike
When the number of observations becomes smaller, variability increases and the correlation coefficient will be attenuated. My guess is that if we looked at, say, 3rd graders in a given school over several years, thus increasing the sample size, the correlation would be higher. Nonetheless, I agree that a closer look at the 75-75 schools is a very good idea.
As an example of how sample size can affect results, Bill Gates found that small schools were overrepresented among high performing schools; had he looked more closely, he would have found that small schools were overrepresented among low-performing schools as well.
LikeLike
So, essentially, Educators stress our kids out over tests that measure how well the EDUCATOR & SCHOOL are doing, & then BLAME LOW INCOME PARENTS when you do not get high enough test results to produce more money in your paychecks & school systems???
Seems to this low-income, inattentive parent who has 3 kids on their way to college, that if you want more money on your check & in your schools, maybe YOU EDUCATORS & SCHOOL BOARD MEMBERS should be taking these ISTEP tests yourselves…but then that would TRULY measure the job YOU do, & well, we can’t have that now can we…
What a complete joke the public school system has become!
LikeLike