The Bloomberg years have been good for New York City in some ways; for example, smoking has been extinguished in all public and even many private places. The mayor’s dedication to public health is highly commendable.
But other things have been disastrous. The mayor has succeeded in making Manhattan a playground for international tourism and the uber-rich, but the explosion of new residential construction has added apartments that sell for millions of dollars. The New York Times, when it endorsed Bill de Blasio for mayor on October 27, noted in passing that 46% of the populace is New York City lives below the poverty line. In a city as expensive as New York City, nearly half the population is poor. That is a sad record, and it is reflected in the continuing struggles of the schools, which must educate the children of those who are homeless, hungry, and in need of intensive supports of all kinds.
At the outset of his administration, some dozen years ago, Mayor Bloomberg decided that the reform of the education system would be his greatest legacy. He said it again and again in his campaign. He was convinced that the only thing missing was management skills, of which he had plenty. He actually claimed that he could get better “results” with the same amount of money (then $12 billion). The spending has more than doubled, but the better results remain elusive. Unfortunately, the mayor decided that testing and accountability and choice would be the strategies that he would rely on to transform the system. In doing so, he mirrored George W. Bush’s No Child Left Behind. That was the zeitgeist of 2002, when Bush signed NCLB and Bloomberg took office and gained complete control of the school system.
Some observers, especially those who live thousands of miles away, are impressed with the Bloomberg record. Certainly the mayor has expanded the public relations staff devoted to selling the story of his “success.” In the years before Bloomberg, there were three people in the press office, whose job was to get information for reporters. Under Bloomberg, the PR staff ballooned, not only at the Department of Education itself, but grew to include the mayor’s own PR staff, so it is difficult to say exactly how many people were paid to “sell” the mayor’s story of success. Some thought it was a staff of at least 20, but it may have been even more.
Sadly, what was lost was any possibility of getting accurate information from the Department of Education. The PR staff existed to “sell the story” and spin results, not to candidly assess what was happening and how initiatives were working. That work was left to independent groups, which found it very difficult to raise money since the mayor used his considerable influence to affect decisions at the city’s major foundations. Anyone who questioned the administration’s claims had a difficult time finding any funding at all.
In pursuit of his elusive goal of 100% success, the mayor went through several iterations. He had three chancellors: Joel Klein, a lawyer, who lasted eight years and reorganized the schools at least three, perhaps four, times; Cathie Black, a publisher, who lasted 90 days and was a disaster, almost singlehandedly wrecking the mayor’s reputation as a reliable judge of management capability and displaying his disdain for anyone who had any experience in education; then Dennis Walcott, who had once headed the Urban League, but was better known for his long and acquiescent service to Bloomberg as an education advisor.
Over the course of this past dozen years, many schools have closed, many schools have opened. Many new schools also closed after they too posted low scores. The mayor never rethought his strategy of closing schools and opening schools, of using test scores and letter grades as measures of school quality. The graduation rate went up, but the remediation rate at local colleges remained staggeringly high.
What the city needs most today is an administration committed to telling the unvarnished truth about what is happening to the students, the teachers, and the school. If it is possible in our society today, the new administration must be prepared to be honest about successes and failures, and devote the resources necessary to have a high-quality internal department of evaluation and research. Much more is needed, but a good place to start is with a firm commitment to tell the truth without spin or hype.
Here is an analysis of the Bloomberg record, written by an insider at the Department of Education.
Click on the images to enlarge them.
Grading A Dozen Years of Education Policy in the Big Apple: A Report Card
As we come to the end of a dozen years of Michael Bloomberg’s control of New York City’s schools, it is an appropriate time to take stock of the results. Using actual data from New York City schools, what do we learn about results of the specific policies implemented over the past 12 years? [1] Is the education of our students better after many changes and new policies? Has the focus on testing students, using test scores and formulas to grade (and punish) teachers and schools, closing schools, opening schools (and closing those schools too), co-locating and championing charter schools and new schools, and the multiple re-organizations of the bureaucracy helped students?
Have you cherry-picked data? These are the real numbers and we have sourced all the data. In fact, some data that were not included show even greater under-performance in New York City schools over the past 12 years. For example, the NAEP results in science show New York City lags behind the national average by 14 points in 4th grade and by 20 points in 8th grade. [15] However, since the most recent data are from 2009 and over 4 years old we did not include them.
Why do some of the metrics have different years of data cited? Because the New York City Department of Education refuses to publicly release complete data sets (and often denies data requests of researchers), we had to use the data we could identify by scouring the web and academic publications. The DOE’s secretive approach to sharing data with researchers, even with all identifying student information removed, is ironic given that they share private student information with corporations. [16]
Is it fair to compare New York City to the national average? The New York City Department of Education uses a similar measure by evaluating individual school in comparison to the performance of all city schools. This means that a school with primarily high needs students is evaluated against screened specialized schools. However, we are fairer than the NYC DOE and do not use the national comparison in the actual scoring. In this context it is worth noting that the formula New York State created and that New York City has implemented to evaluate teachers based on students test scores penalizes teachers who teach significant numbers of disadvantaged students. [17]
Why do you use test scores as your evaluative criteria? Because these are the very criteria that the education policies in New York were based on. As it turns out, even on their own terms, the policies have shown very poor outcomes. Even with the deck stacked in favor of Bloomberg’s policies the data still show that the policies have not been successful. If we were to add other criteria such as quality arts programs things are even worse. Data self-reported by schools shows that since 2006 elementary school students have at least 5% fewer opportunities to take visual arts, dance, theater and music classes taught by arts teachers. This is clearly an underestimate of the loss of arts options for students as an independent audit has demonstrated. [18]
How do you explain the increase in graduation rate in New York City? An independent study based on full access to DOE records and internal emails would help answer this question. A couple of points are in order.
A) The New York State Regents exams were made significantly easier over the past dozen years especially in terms of the grading scale applied to the exams. Math is an illustrative example. The Sequential Math 1 exam required the test taker to earn 65 percent of the available points to receive a passing score. The Math A exam, which replaced Sequential 1 in June 2002, required the test taker to earn 43 percent of the available points to receive a passing score. The Integrated Algebra exam, which replaced the Math A exam in 2009, requires the test taker to earn only 34.5 percent of the available points to receive a passing score. [19] Additionally the Biology exam was replaced by the Living Environment exam in 2001 and the Global Studies exam by the Global History exam in 2000. In each case the newer version was less content driven. [20]An academic study looking at changes in scoring and in difficulty of the Regents exams over the past 15 or so years would fill a gaping hole in our ability to make sense of test trends.
B) Schools were graded on the number of students earning credit. This led to some schools having jumps of 30-55+ percentage points in the number of students passing 10 or more classes. [21]In the space of 4 years the overall level of credit accumulation by students increased by 16 percentage points. [22]This can only be explained as being due to a citywide lowering of the bar on the expectations for earning credit, leading to a higher graduation rate, presumably at the cost of the actual quality of the diploma/college readiness of the student. [23]
C) The demographics of school age children in New York City changed dramatically since 2000, with white and Asian children becoming an increasingly larger proportion of the population. [24]As is well-known those demographic groups have significantly more educational success than Black and Latino children. Closing this achievement gap is one of the core missions of public education.
D) How can the increase in graduation rate reflect true increases in student learning when the grades 3-8 test scores have been mostly flat over the past dozen years? [25]Did students miraculously begin to learn more only when they hit 12th grade? The 8th grade Math/ELA scores on the NAEP increased by less 1.5% between 2003 and 2009, significantly less than the increase of other large urban school districts. How does that translate into an increase in graduation rates 4 years later unless the quality of a high school diploma and the bar for earning one was significantly lowered during that time?
E) The New York City Department of Education likes to compare its numbers to those of the “Big 5” cities (NYC, Buffalo, Rochester, Syracuse and Yonkers) in New York State. This is a deliberately misleading comparison as only 1 of these cities, Yonkers, is demographically similar to New York City. [26] NYC has significantly underperformed when compared to Yonkers. In fact, since 2008 the graduation rate in NYC has barely budged (the percent of students graduating by August after 4 years having gone from 62.7% to 64.7%). Yonkers, on the other hand, has seen its graduation rate increase by over 9 percentage points (from 62.9% to 72.1%). [27] Yonkers has outperformed New York City while serving a similar student population.
Bottom line: The data used here is comparable across years. It is more reliable than graduation rate which is a social construct having no set criteria or meaning. New York City underperforms on graduation rate when compared to comparable districts in New York State.
What does this all mean for the future of education in New York City? It means that we have our work cut out for us, as does the next mayor. With each mistake made over the last dozen years we have learned how we can do better. What have we learned?
- We need to ensure that every single school has as diverse a student body as possible. Whether G&T programs, screened or specialized high schools, all schools must have a student body that reflects the diversity of New York City. The Office of Enrollment must improve their systems so that diversity is a crucial element of the process.
- We need to provide schools with expert support and guidance in curriculum. We cannot take a sink or swim approach to teaching and learning, with every school left to their own devices. The Office of Teaching and Learning must be re-opened after having been shuttered under Bloomberg. Truly expert teachers must be identified at each grade level and subject area, their lessons videoed, their materials copied, and all of such resources must be shared with teachers throughout the city.
- We need to develop rich early intervention and support services for students. This includes vastly increasing the number of speech teachers and math and reading intervention specialists in elementary schools. We cannot pretend that merely increasing the demands we make on students with the Common Core can take the place of our responsibility to support students in the critical early years to ensure they do not fall behind. This will also require developing a citywide early warning system and specialized curriculum to identify and provide quality remedial opportunities to students who are falling behind.
- We need to provide support to schools that are struggling. It is wrong to continue to close schools just because they serve a high-needs student population. [28]Teams of experts must be formed to work directly with such schools in the areas of programming, data, and instructional cohesion. Each team must be assigned to one school to ensure quality support. This will also require changing Fair Student Funding so that all schools are funded equitably. [29]
- We need to reform the DOE central office so that they take ownership of, are responsible for, and are held accountable for the success of every school (and student) in New York City. They must do the hard work of helping all schools and students improve. [30]They can no longer be allowed to take the easy way out. [31] The enormous support for a small percentage of charter schools, with no clear improvement in performance, makes no sense. The significant resources and PR devoted to the charter sector must end, while ensuring that the 6% of NYC’s children in charter schools receive a quality education. [32]Instead of destroying existing schools in order to create new schools we must add new and 21st century aligned academic and CTE programs to the schools we already have to ensure their success and that students have genuine choices and opportunities. [33]
- We need to create an independent research office to evaluate educational initiatives so that the metrics are uniform across schools and can’t be gamed. [34]This office should report to the Panel for Educational Policy whose members should be selected to time- limited terms of office. The panel will then collaborate with the mayor in ensuring that community voice is heard.
- We need to reorganize the bureaucracy so that schools are evaluated and coached on instructional techniques and youth development approaches by geographically based personnel with knowledge of the school and community. Other functions such as budgeting, HR and the like should be run out of regional offices. Web-based platforms will allow schools to form non-geographic affinity groups so that similar schools can share ideas no matter how far apart they are in the city.
- We need to think creatively about ways to provide students with the additional quality learning time they need to succeed. The school year should be extended with a shorter summer break in the month of July and the new school year beginning again at the start of August. Summer learning loss is a huge factor in diminished student outcomes and we must address it system-wide.
- Finally, we need to develop better ways to communicate with parents and communities to present an accurate picture of school performance. The current system penalizes schools and teachers who work with high-needs students. These are the precise parents and families who need the most help. Transparency about these factors must be improved.
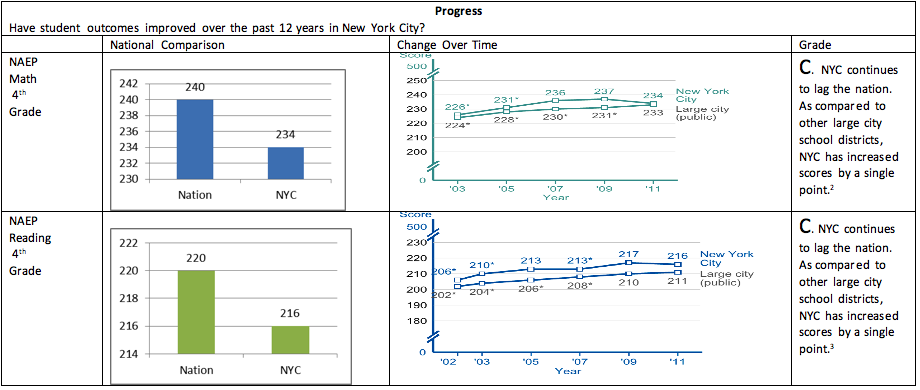
[1] There have been some earlier attempts to answer this question https://dianeravitch.net/2012/10/02/after-a-decade-bloomberg-reforms-still-failing/. Our grading policy is as follows: significant improvement (by 10+%) over the past dozen or so years=A, improvement (2-9%) over the past dozen or so years=B, flatlining (-1,0,+1) over the past dozen or so years=C, decline (-2- -9%) over the past dozen or so years=D, significant decline (-10+%) over the past dozen years=F. This is, of course, a rather charitable grading policy as it assumes that no improvement even after a dozen years earns a gentleman’s C and not a F. We will weigh the 3 sections using the same weights as the School Report Cards implemented under Mike Bloomberg for New York City schools. Progress=60% of the final grade, Performance=25% of the final grade and Environment=15% of the final grade.
[2] http://nces.ed.gov/nationsreportcard/pdf/dst2011/2012453XN4.pdf
[3] http://nces.ed.gov/nationsreportcard/pdf/dst2011/2012456XN4.pdf
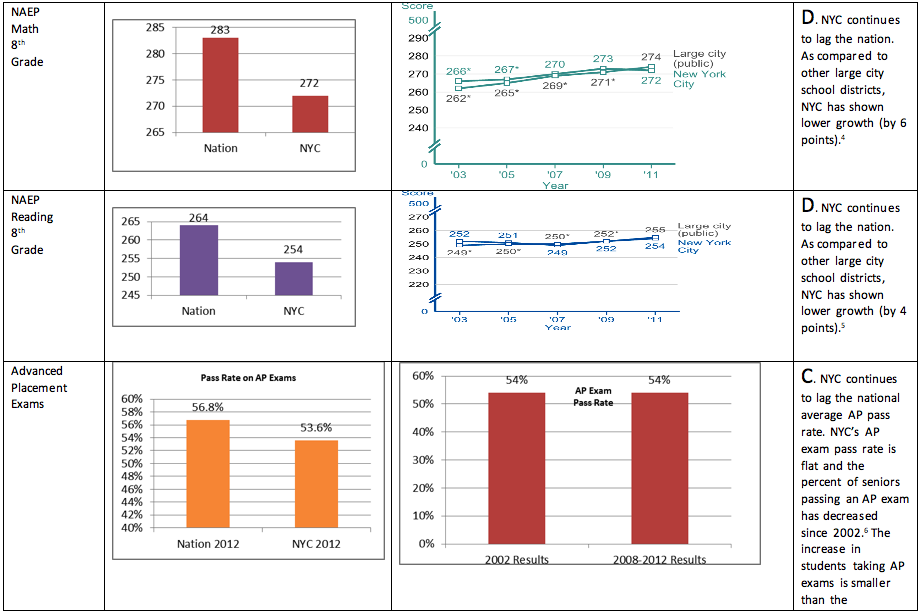
[4] http://nces.ed.gov/nationsreportcard/pdf/dst2011/2012453XN8.pdf
[5] http://nces.ed.gov/nationsreportcard/pdf/dst2011/2012456XN8.pdf
[6] http://cityroom.blogs.nytimes.com/2011/02/09/15-of-high-school-seniors-passed-an-a-p-test-last-year/ and http://nypost.com/2010/02/11/ny-schoolkids-do-a-ok-on-ap-tests/
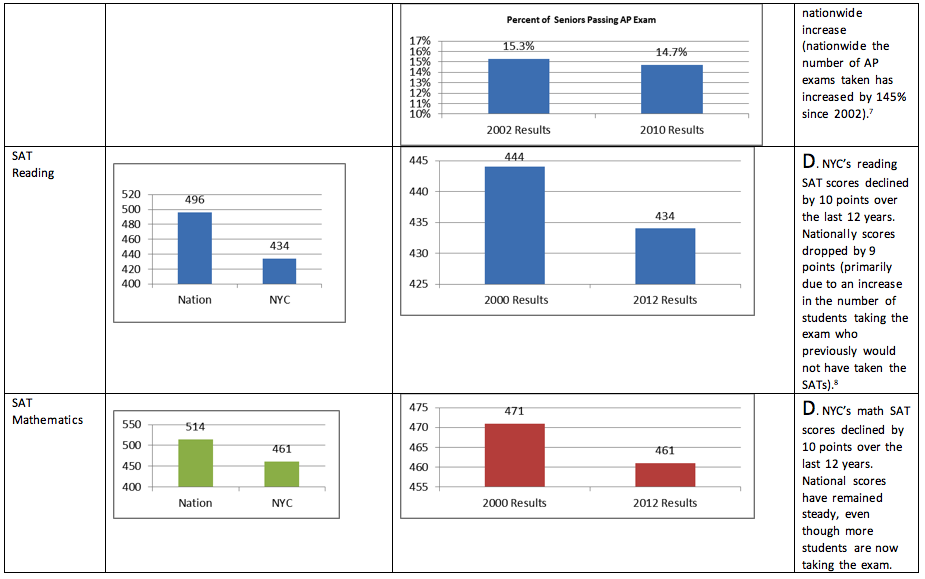
[7] http://media.collegeboard.com/digitalServices/pdf/ap/rtn/9th-annual/9th-annual-ap-report-appendix-b.pdf nationwide AP results
[8] http://www.manhattan-institute.org/html/cr_26.htm NYC’s 2000 SAT results. http://nces.ed.gov/fastfacts/display.asp?id=171 nationwide SAT results through 2011. http://professionals.collegeboard.com/testing/sat-reasoning/scores/averages 2012 SAT results.
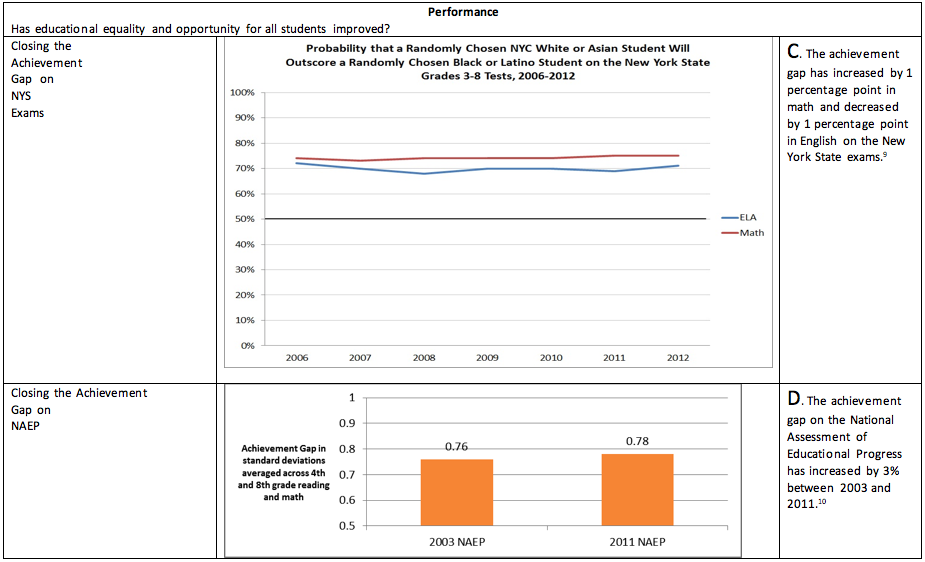
[9] http://eyeoned.org/content/closing-the-achievement-gap-have-we-flat-lined_379/
[10] http://eyeoned.org/content/the-emperors-new-close_313/
[11] http://schools.nyc.gov/NR/rdonlyres/B54A0720-E4EE-432D-A322-940346CCE61B/0/2013DemographicSnapshotPUBLIC.xlsx and http://www.nytimes.com/interactive/2012/05/11/nyregion/segregation-in-new-york-city-public-schools.html?_r=0 showing that “Black isolation in schools has persisted even as residential segregation has declined.” https://dianeravitch.net/2013/09/08/insider-at-bloomberg-doe-spills-the-beans-about-failed-policies/ has data on the extreme inequities in school outcomes where only a small handful of NYC produce outcomes at the national average. Finally, the Independent Budget Office has shown that from 2002-2011 school integration has remained flat http://www.ibo.nyc.ny.us/iboreports/printnycbtn11.pdf
[12] http://www.nytimes.com/interactive/2011/09/07/nyregion/20110907-nyc-schools-poll.html?ref=education
[13] The DOE, when reporting numbers, often uses percent increase rather than the actual number of percentage points. This makes small gains looks much larger than they otherwise would.
[14] Following the formula outlined in the first footnote the calculation is as follows: Progress x 60% + Performance x 25% + Environment x 15%= Final Grade. Replacing the letter grades with numbers A=1, B=2, C=3, D=4, F=5. The scores of each component were averaged and plugged into the formula as follows: (4.1667 x .6) + (3.3333 x .25) + (5 x .15) = 4.08=D.
[15] http://nces.ed.gov/nationsreportcard/pdf/dst2007/2008471XN8.pdf
[16] http://www.nytimes.com/2013/10/06/business/deciding-who-sees-students-data.html.
[17] http://www.lhcss.org/positionpapers/nysgrowthmodel.pdf
[19] http://nycpublicschoolparents.blogspot.com/2008/01/ny-state-math-regents-exams-soft.html and http://atfss.wordpress.com/nys-regents/. Note that these numbers vary slightly with each exam.
[20] http://www.city-journal.org/2009/eon0731me.html
[21] http://blogs.edweek.org/edweek/eduwonkette/2008/11/the_nyc_high_school_progress_r_1.html
[22] http://www.edwize.org/credit-accumulation-soars-in-nyc-but-students-remain-behind
[23] Note that this may be very good public policy. Lowering the bar for a high school diploma so that more young adults have the opportunities for college education and job training where there is more flexibility around pursuing one’s interests is intuitively smart policy. However, when the bar is lowered policy-makers can’t claim that the graduation rate is comparable to earlier rates.
[24] “The fact is, the number of children in New York decreased by almost 9 percent between 2000 and 2010. According to the Department of City Planning, the black population under 18 decreased especially dramatically during those ten years, by 22.4 percent, while the population of white children decreased by only 3.8 percent. In the city’s richest borough, Manhattan, the number of white kids actually grew—by nearly 23 percent—and in rapidly gentrifying Brooklyn, the number of white kids increased by 7 percent. (The displacement of blacks and Latinos in some neighborhoods is painfully pronounced: In Brooklyn’s District 6, which encompasses Park Slope, the South Slope, Cobble Hill, Carroll Gardens, and Red Hook, the number of white kids grew by 28.5 percent while the number of black and Hispanic kids each dropped by 36 percent.) Asians are the one ethnic group whose number of children increased overall during the decade.” http://nymag.com/news/features/childhood/modern-childhood-2013-4/index3.html
[25] http://gothamschools.org/2010/07/28/test-scores-down-sharply-biggest-decline-for-needy-students/ data showing flat scores after New York State stopped lowering the bar for proficiency on the grades 3-8 exams.
[26] http://assembly.state.ny.us/member_files/044/20090319/report.pdf
[27] http://www.p12.nysed.gov/irs/pressRelease/20130617/GradRateSlides.ppt
[28] http://annenberginstitute.org/sites/default/files/SchoolTransformationReport_0.pdf https://dianeravitch.net/2012/08/25/nycs-schools-for-poorest-faring-poorly/ and https://dianeravitch.net/2012/08/09/after-ten-years-of-reform-in-new-york-city/
[29] https://dianeravitch.net/2012/09/05/how-new-york-city-stiffs-the-neediest-students/ https://dianeravitch.net/2012/08/12/in-nyc-fair-student-funding-is-unfair/ and https://dianeravitch.net/2012/08/30/who-is-putting-children-first/
[30] https://dianeravitch.net/2012/10/17/if-teachers-ran-their-classes-like-nyc-runs-schools-then/
[31] https://dianeravitch.net/2013/10/22/a-report-from-the-sinking-ship-at-nycs-doe-headquarters/
[32] https://dianeravitch.net/2013/10/15/the-charter-school-bubble-in-new-york-city/ on spending for charter schools. https://dianeravitch.net/2013/02/26/an-inside-the-doe-view-of-the-nyc-credo-study/ on the performance of charter schools. https://dianeravitch.net/2012/12/20/inflated-claims-of-charter-success-in-nyc/ and https://dianeravitch.net/2012/12/03/reader-calls-out-ny-daily-news-for-charter-spin-2/ on the exaggerated PR on behalf of charter schools.
[33] https://dianeravitch.net/2013/03/01/why-nyc-closes-high-schools/ on the coddling of new schools at the expense of existing ones.
[34] https://dianeravitch.net/2013/09/19/nyc-whistle-blower-how-the-doe-is-like-enron/


I’m all for DOEd reform, particularly on who is getting our public education money. Until then, change at the state levels will be slow. Transparency on DoEd’s criteria for receiving federal grants is inadequate. For example, In June, the federal DoEd froze all new IES grants and funded only continuing grants. Public universities depend on federal grants to begin new research projects, fund graduate students who innovate and support research, and evaluate innovations. The rational for freezing public money is sequestration.
Then I happened upon this:
http://www.ed.gov/news/press-releases/us-department-education-awards-30-million-grants-support-teacher-and-principal-d
TfA received over $8 million in grants; NEIT received over $2million in grants.
Our public universities that train educators are starving and the US DoEd doles out tax money to privatizers who show no evidence of success. The rot begins at the top.
LikeLike
http://edushyster.com/?p=3537#more-3537
Corrupt to the core.
LikeLike
As an educator at the high school level for almost 15 years, I can agree with much of the analysis. Standards for passing classes has been dramatically lowered in many schools, while Regents passing rates have remained flat or even lowered. By tying the future of the schools, and consequently the principals, to a report card which heavily reflects on credit accumulation, teachers are bullied into lowering their standards (especially those that are non-tenured.) Principals create passing rates and when they are not reached they would write those into classroom observation. Satisfactory teachers all of a sudden become unsatisfactory. Either get in line and reach the goal, or find a new career. It doesn’t matter why students don’t pass. Never came to school? Should have been classified as learning disabled 10 years ago? Doesn’t matter. I’ve seen students pass classes while missing over 50% of the instructional time. I’ve seen students pass almost every single class in their high school career and fail every single corresponding Regents. A lot of them. Sure those things can happen in extreme circumstances, but not as often as it does. Resources need to be provided, not blame assigned. What would make for an interesting comparison would be course v. Regents passing rate. Obviously Regents aren’t THE perfect measurement, but in many ways they do allow students to demonstrate basic knowledge.
LikeLike
Great post! Very thorough. As an advocate for summer learning programs, I was very happy to see summer learning loss as an area of improvement for NYC schools. Summer learning loss is a real problem for students all over the U.S. I believe that while Bloomberg’s Reforms were all done with good intentions, however, the execution and thinking was not all there. I believe in programs (the one I favor is called ThinkStretch) that allow parents, teachers, and administrators to cater to their students needs. I don’t think a systematic approach to summer learning loss is completely appropriate, as every child, class, and community have different needs. ThinkStretch is flexible, in that it works well in a variety of cases. It provides the much-needed balance of learning and fun, so kids actually enjoy it. The best part is, is that it’s proven to work in stopping summer learning loss. In all, I believe reforms to education should be more flexible, incorporating educational programs like ThinkStretch within different levels of the community. For more information on ThinkStretch and their students’ success, you can click the link here: http://www.thinkstretch.com/thinkstretch-maintains-academic-skills/
FULL DISCLOSURE: I don’t work for ThinkStretch, but I do help with their digital marketing.
LikeLike