Bruce Baker, a specialist in school finance, writes here about the longstanding underfunding of Philadelphia’s public schools and the consequences of the funding gap with the city’s suburbs.
He writes:
Abbott Elementary plays it for laughs. Janine Teagues hunts for a working rug, a functioning copier, a single extra aide. Barbara Howard has seen every reform come and go. Gregory Eddie inherits a classroom with no curriculum. Melissa Schemmenti knows a guy who can get the supplies the district can’t.
The show is entertaining. The damage is real. Behind every running gag is a funding gap that has been measurable, year after year, for at least fifteen years, and that has landed on real children in real Philadelphia classrooms.
Philadelphia’s district schools have spent between a third and a half less than what it would cost to get their students to national-average outcomes in every year from 2009 to 2023. Over the same years, the 61 suburban districts in Bucks, Chester, Delaware and Montgomery counties spent between half again and twice what their own students needed. We laugh at the broken boilers, missing counselors and teachers buying their own supplies. The kids living it don’t get a laugh track.
What follows walks from the money to the classroom: first the adequacy gap, then the simple “screwed city” picture, then teachers per child, teacher pay, and finally who is actually standing in front of the kids.
Fifteen years below the line
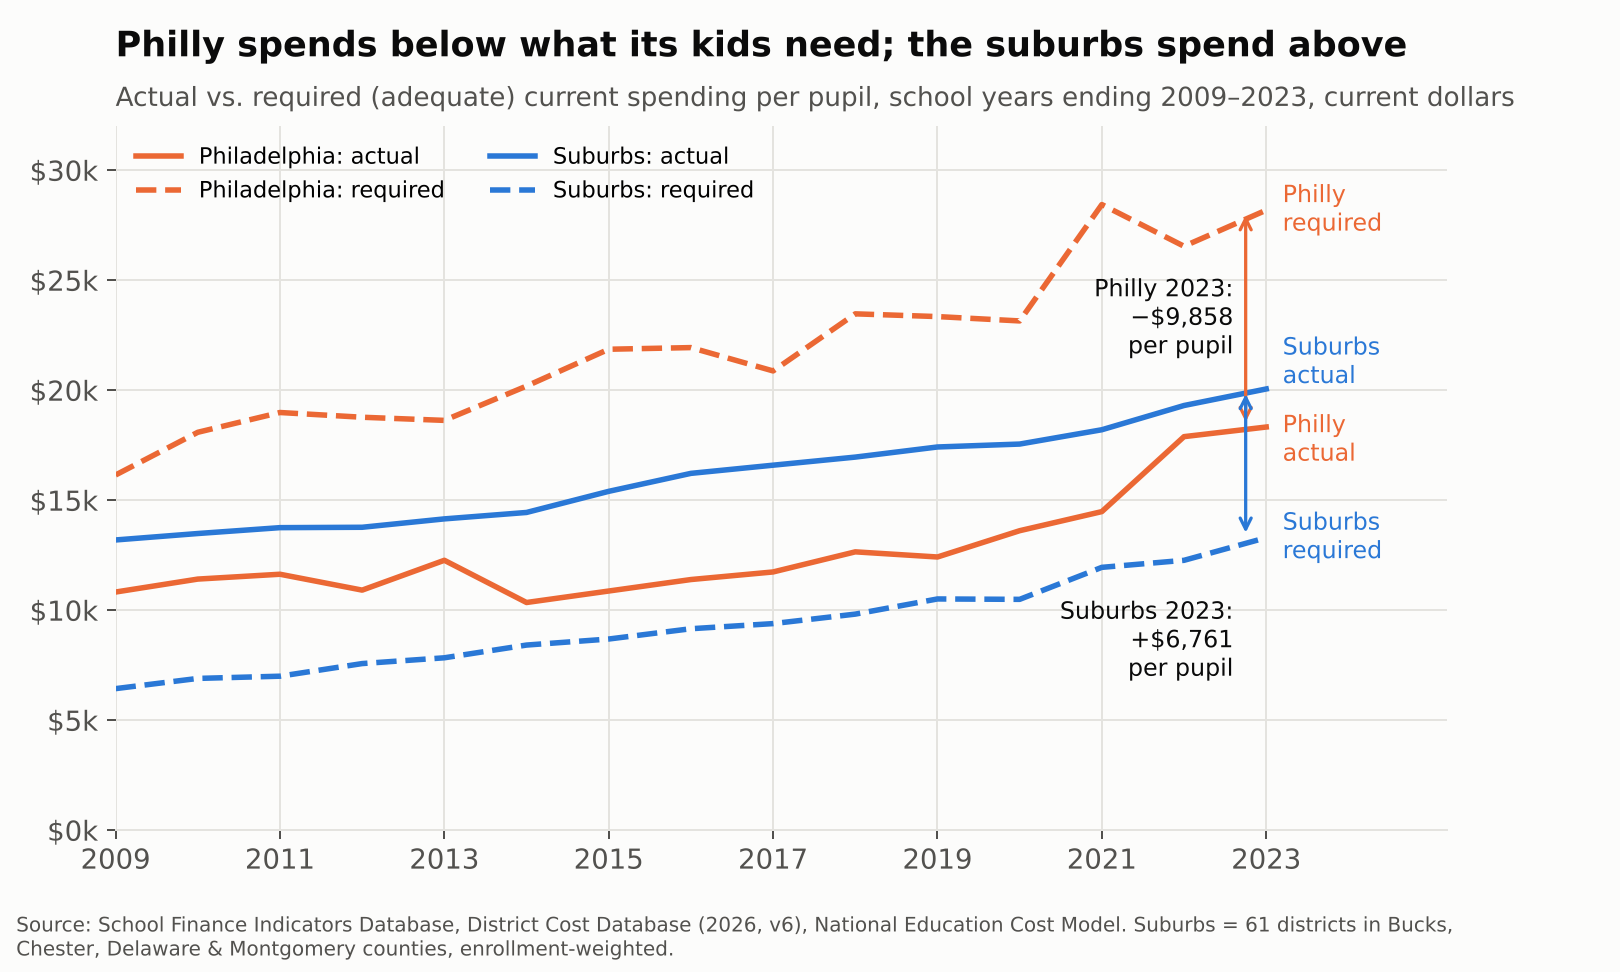
In 2022-23, the School District of Philadelphia spent $18,329 per pupil. Our National Education Cost Model estimates it would have needed $28,187 to give its students a shot at national-average test scores. That is a gap of $9,858 per child, or roughly $1.2 billion across 118,000 students, in a single year.
The suburbs face the mirror image. Their enrollment-weighted average spending was $20,059 against a required $13,298, a surplus of $6,761 per child. Same metro, same labor market, same state constitution.
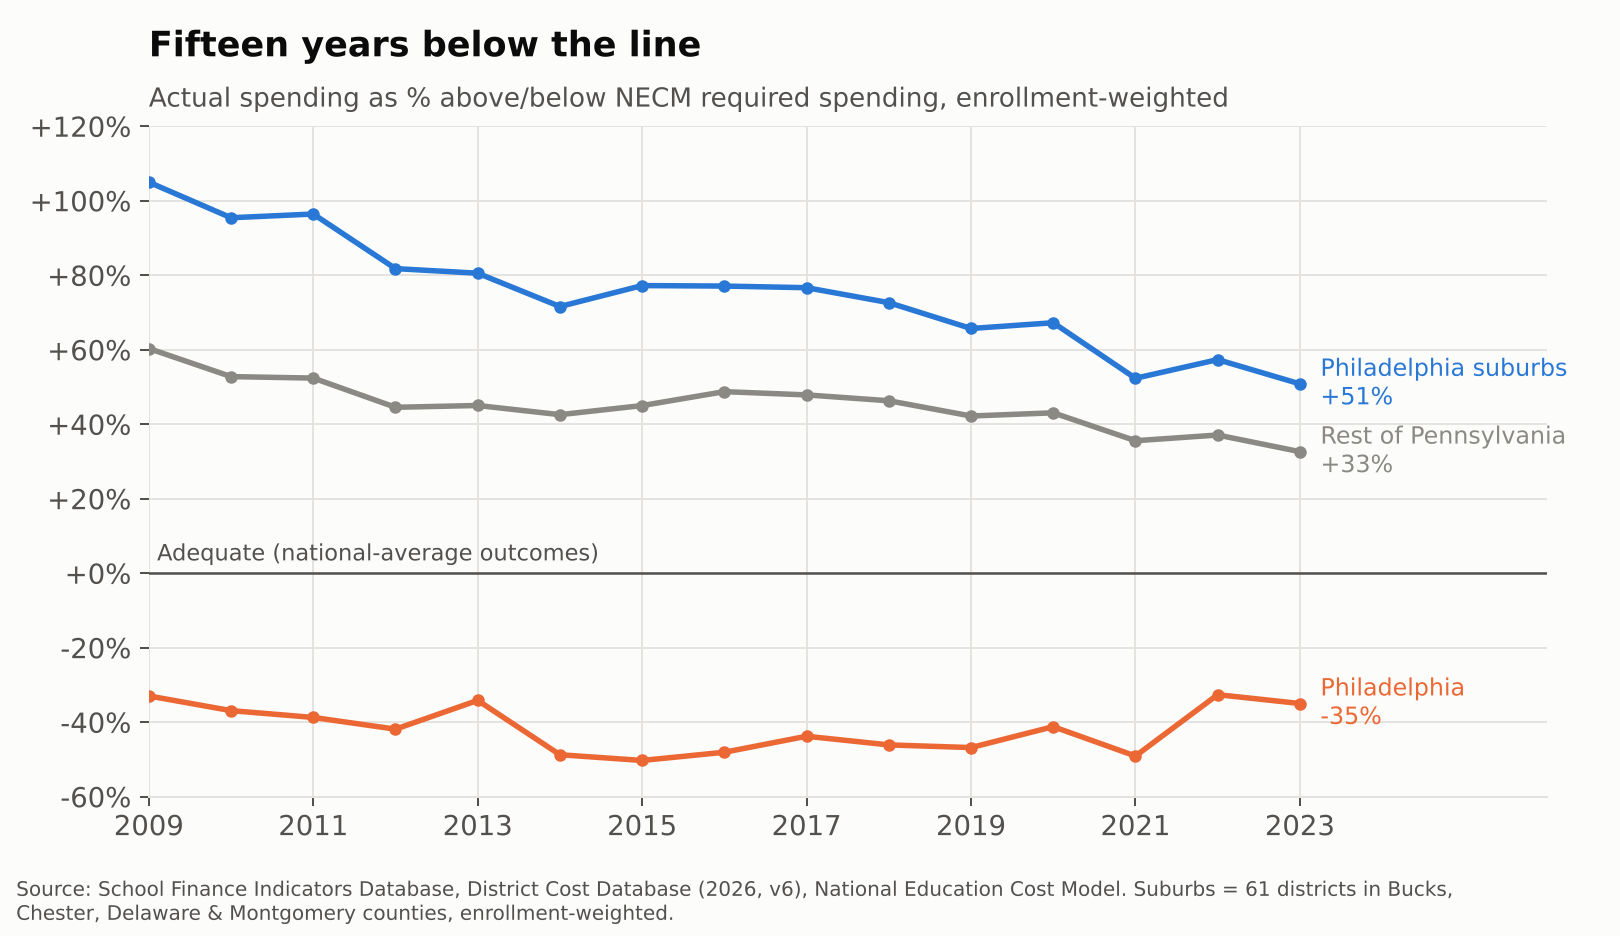
This is not a recent dip. Philadelphia sat 33% below its adequacy target in 2009, sank to 50% below in 2015 in the wake of the “doomsday” budgets, and was still 35% short in 2023, even with federal pandemic aid in the mix. The suburbs started out spending more than double their target and have drifted down to about 51% above it. The rest of Pennsylvania sits in between, about a third above.
The outcome side tells the same story. Philadelphia’s students scored roughly 0.8 standard deviations below the national average in 2022-23, while suburban students scored about 0.2 above. Abbott’s students are not falling short because nobody cares. They are falling short where the money falls short.
Open the link to read the full report.


Philadelphia like many other cities has suffered from a change in demographics. Philadelphia has always been diverse. Years ago there were Black neighborhoods, white neighborhoods and some integrated ones. Today, a much greater number of neighborhoods are Black, Latino and poor. White flight has resulted in thriving, affluent suburbs with people that hop on the train to work or attend the city’s many sporting and entertainment events. The proliferation of charter schools in the city has only further impoverished the existing public schools. As long as we tie school funding to the local tax base, this will continue to be an issue of funding inequity in cities with large numbers of disadvantaged people.
LikeLiked by 1 person
May I use this posting with my freshman education majors? We are discussing school finance.
thank you
LikeLike
Yes of course
LikeLike
Thank you! I read every one of your postings. They inform how I help prepare the next generation of students. MP
LikeLike
Thank you, Margarita. I stand u for public schools and democracy. Two worthy purposes.
LikeLike