Paul Thomas taught in public high schools for many years, before becoming a professor at Furman College in South Carolina. He is a persistent critic of the “Mississippi Miracle.” He uses data to check on state claims. In this post, he fact-checks Florida.
He wrote:
Reading proficiency is a powerful data point despite it being a moving target.
When anyone refers to “reading proficiency,” that usually means a percentage of students who have met or exceeded an established score on a standardized test of reading.
However, “proficiency” is not a standard term. States tend to use “proficient” as grade level expectations while NAEP uses “proficient” as an aspirational achievement level (and “basic” more closely correlates with state grade-level proficiency).
To further complicate “reading proficiency,” not only does the measurement vary from state to state, but also the expectations for what percentage of students should be proficient at any grade is more a debate than an established fact.
How many students should be proficient in reading? Sometimes it is 90%; sometimes it is 95%—and then there are state goals, for example, in Florida, as reported by Aldeman:
A 10-part video series produced by the Children’s Literacy Project tells what happened. It makes a compelling case that these results are attributable to a distinctive public-private partnership between the district and a nonprofit called The Learning Alliance. The story starts with two moms, Liz Woody-Remington and Barbara Hammond, whose children were struggling to read. In 2010, they asked themselves: What would it take to get 90% of the district’s children reading on grade level by the end of third grade?
I find these statistics troubling, similar to concerns raised by Hansford:
Over the years, I have on numerous occasions seen the claim that 95% of students can learn how to read proficiently, so long as they are provided adequate tier 1/2 instruction. Truthfully, it has always stuck out to me as a strange figure, for three reasons. First, most academic research does not typically use percentages in this sort of manner. Second, I often see this figure unaccompanied by a citation. And third, it seems low; I find it hard to believe that 5% of students just cannot learn how to read. …For this figure to have scientific validity, it would need experimental research demonstrating it to be true. Ideally, I would want to see multiple large scale studies, due to the universality of the claim. Intrigued by the discussion, I put out a public call on twitter asking if anyone had a citation for the figure.
Hansford walks us through the research (thin at best) and reaches an interesting conclusion:
This all said, it does seem there is some level of support for 96% being a benchmark goal, for reading proficiency rates. While some might argue, this is too high, I worry it’s too low, as it is clearly possible to achieve better than 96%. For example, in the Torgesen 2003 paper, 98.4% of students were able to read at grade level. When I asked for research on this topic, I was given an anecdote about a school using EBLI that went from 87% proficiency rates to 100%, within a matter of years. Well this is just an anecdote. I do think 100% proficiency is—in many cases—possible and should always be the goal.
I think the points here that must not be missed are the role of “anecdote” in claims about reading proficiency as well as claims about surprising gains and outlier “miracle” evidence, such as, again, Aldeman highlights:
Even more impressively, low-income third graders at Indian River schools scored better than the statewide average for all students. And, perhaps not surprisingly, when we went looking for high-poverty schools that were nevertheless getting good outcomes in reading, we identified three of the district’s schools — Rosewood Magnet, Fellsmere Elementary and Pelican Island Elementary — for our “Bright Spots” list. Fellsmere in particular stood out: Based on its 99% poverty rate, our calculations predicted that it would have a third grade reading rate of just 29%. But its actual rate was much higher, at 53%.
Indian River County was never exactly a failing district, but a decade ago it was performing a bit worse than the state as a whole. It has since begun to pull away, especially in third grade. Coming out of the pandemic, 60% of district third graders scored proficient in reading in 2023. That figure rose to 63% in 2024 and then jumped again, to 69%, in 2025.
This reporting fits into a “beating the odds”approach that frames outlier evidence as the normfor an entire population.
The evidence [1] is overwhelming in education that outlier “miracle” evidence is usually misleading or false, and even more problematic, outlier success, when valid, is rarely scalable.
In short, “beating the odds” stories make for compelling journalism and politics but not for effective or reasonable education reform.
These stories from Florida also raise some red flags.
The organization promoting this reform, Children’s Literacy Project, is faith-based.
Like other Republican states such as Oklahoma and Texas, Florida is seeking ways to erode the separation of church and state, specifically in public schools.
Schools partnering with organizations to promote and support reform is not necessarily a problem, but the outside help does create tensions about ideology as well as erodes the likelihood reforms are scalable.
Another few aspects of Florida are not highlighted in the reporting but deserve attention.
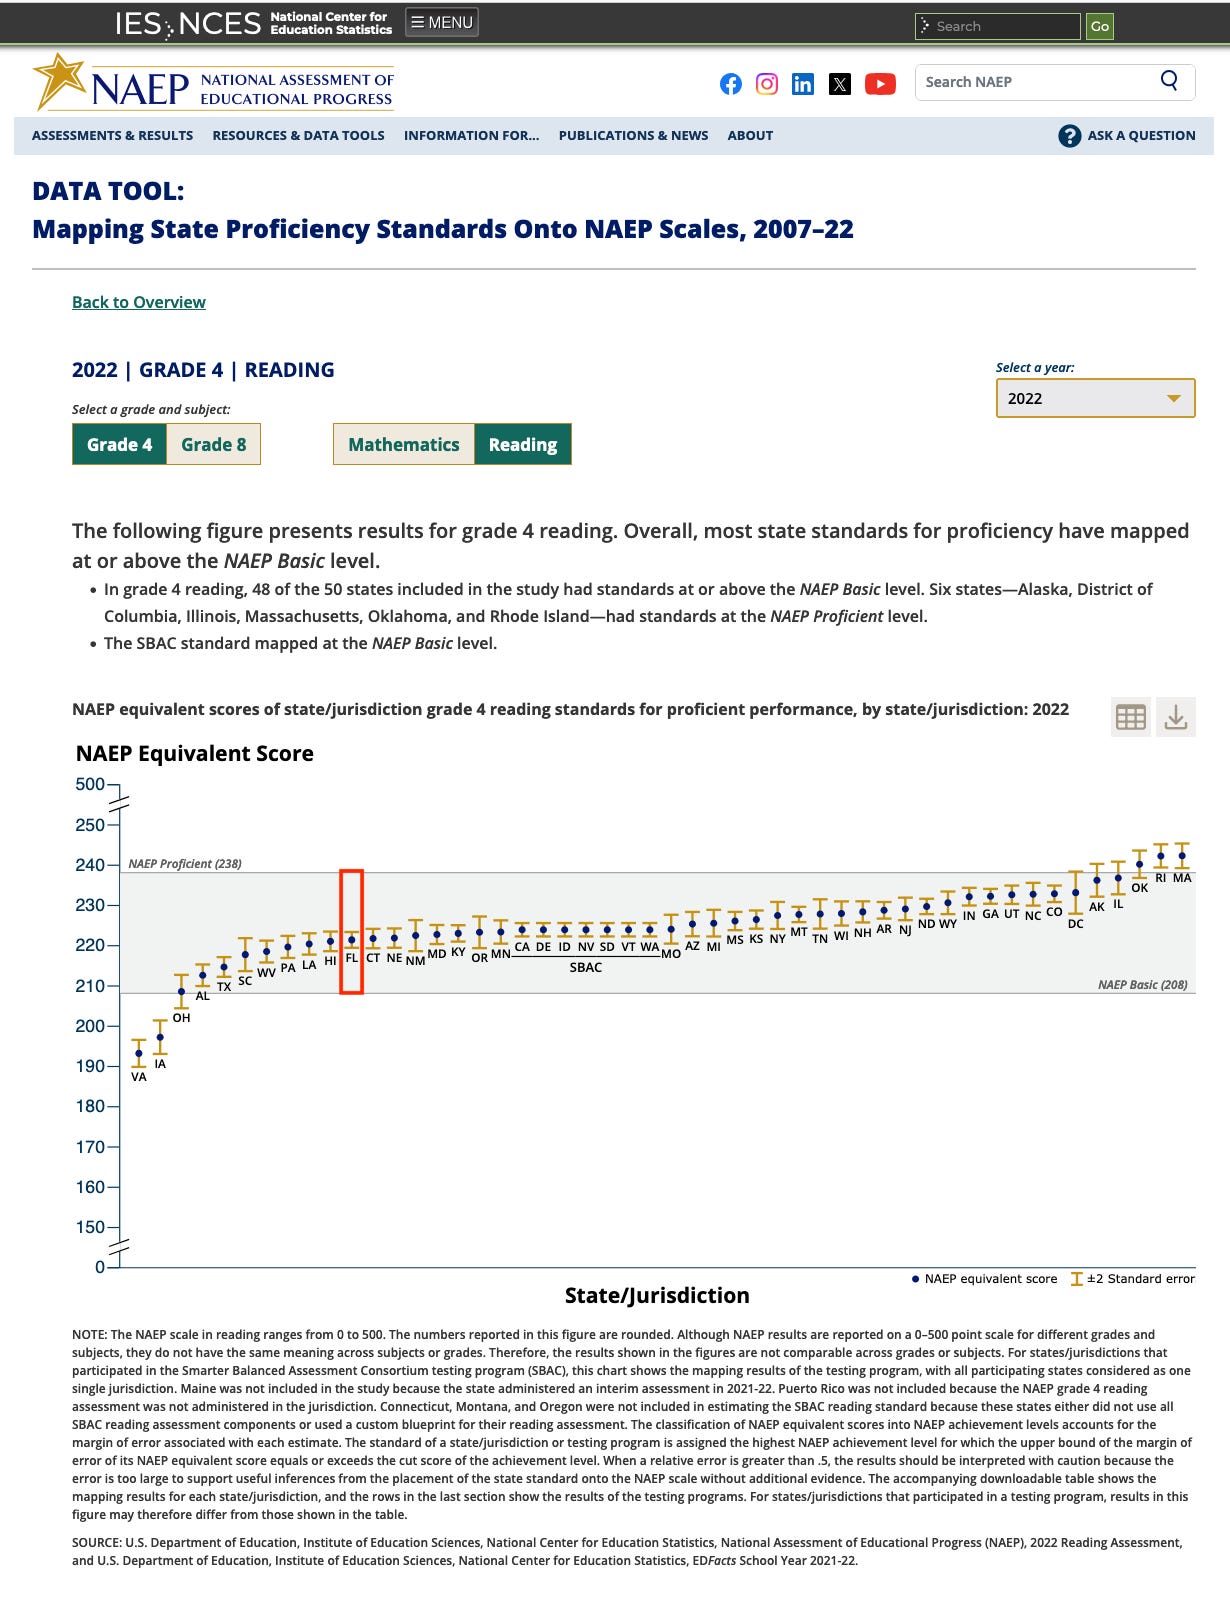
Returning to measurements of reading proficiency, Florida is in the bottom quartile of states in terms of the standard for “proficient”:
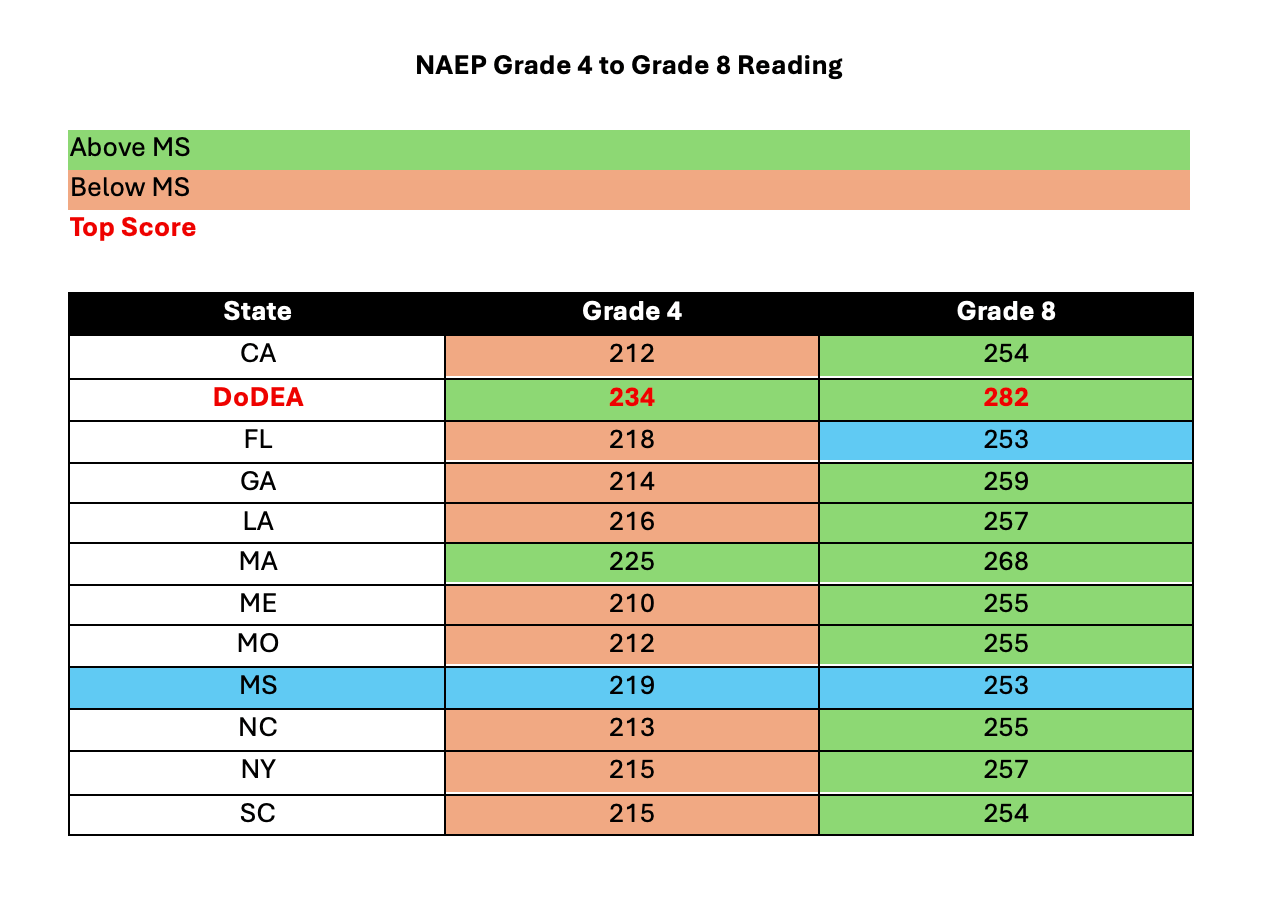
Florida, like Mississippi, is also a state where relative success in grade 4 reading quickly evaporates by grade 8:
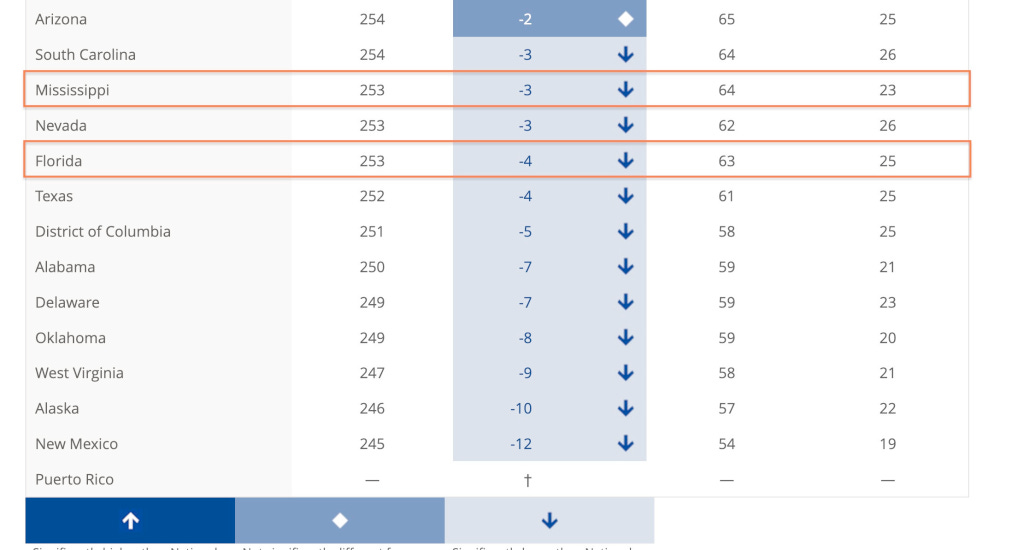
Again like Mississippi, Florida is in the top of states for grade 4 reading on NAEP, but drops to the bottom quartile in grade 8:
Finally, the media and political story most often focuses on reforms in reading programs, teacher training, school leadership, and school expectations; however, outlier and surprising gains in grade 4 reading are likely driven by grade retention (a harmful punishment) and not the celebrated reforms.
Notably, high-grade retention states like Florida and Mississippi are also the states with significant decreases from grade 4 to grade 8.
Florida has a long history of aligning itself with “miracle” education reform that proves to be a mirage.
Beware the current numbers game about reading proficiency—a measurement that changes with the political wind.
[1] Thomas, P.L. (2016). Miracle schools or political scam? In W.J. Mathis & T.M. Trujillo, Learning from the Federal Market-Based Reforms: Lessons for ESSA. Charlotte, NC: IAP.


. To further complicate “reading proficiency,” not only does the measurement vary from state to state, but also the expectations for what percentage of students should be proficient at any grade is more a debate than an established fact. How many students should be proficient in reading? Sometimes it is 90%; sometimes it is 95%—and then there are state goals, for example, in Florida, as reported by Aldeman: A 10-part video series produced by the Children’s Literacy Project tells what happened. It makes a compelling case that these results are attributable to a distinctive public-private partnership between the district and a nonprofit called The Learning Alliance. The story starts with two moms, Liz Woody-Remington and Barbara Hammond, whose children were struggling to read. In 2010, they asked themselves: What would it take to get 90% of the district’s children reading on grade level by the end of third grade? I find these statistics troubling, similar to concerns raised by Hansford: Over the years, I have on numerous occasions seen the claim that 95% of students can learn how to read proficiently, so long as they are provided adequate tier 1/2 instruction. Truthfully, it has always stuck out to me as a strange figure, for three reasons. First, most academic research does not typically use percentages in this sort of manner. Second, I often see this figure unaccompanied by a citation. And third, it seems low; I find it hard to believe that 5% of students just cannot learn how to read. …For this figure to have scientific validity, it would need experimental research demonstrating it to be true. Ideally, I would want to see multiple large scale studies, due to the universality of the claim. Intrigued by the discussion, I put out a public call on twitter asking if anyone had a citation for the figure. Hansford walks us through the research (thin at best) and reaches an interesting conclusion: This all said, it does seem there is some level of support for 96% being a benchmark goal, for reading proficiency rates. While some might argue, this is too high, I worry it's too low, as it is clearly possible to achieve better than 96%. For example, in the Torgesen 2003 paper, 98.4% of students were able to read at grade level. When I asked for research on this topic, I was given an anecdote about a school using EBLI that went from 87% proficiency rates to 100%, within a matter of years. Well this is just an anecdote. I do think 100% proficiency is—in many cases—possible and should always be the goal. I think the points here that must not be missed are the role of “anecdote” in claims about reading proficiency as well as claims about surprising gains and outlier “miracle” evidence, such as, again, Aldeman highlights: Even more impressively, low-income third graders at Indian River schools scored better than the statewide average for all students. And, perhaps not surprisingly, when we went looking for high-poverty schools that were nevertheless getting good outcomes in reading, we identified three of the district’s schools — Rosewood Magnet, Fellsmere Elementary and Pelican Island Elementary — for our “Bright Spots” list. Fellsmere in particular stood out: Based on its 99% poverty rate, our calculations predicted that it would have a third grade reading rate of just 29%. But its actual rate was much higher, at 53%. Indian River County was never exactly a failing district, but a decade ago it was performing a bit worse than the state as a whole. It has since begun to pull away, especially in third grade. Coming out of the pandemic, 60% of district third graders scored proficient in reading in 2023. That figure rose to 63% in 2024 and then jumped again, to 69%, in 2025. This reporting fits into a “beating the odds” approach that frames outlier evidence as the norm for an entire population. The evidence [1] is overwhelming in education that outlier “miracle” evidence is usually misleading or false, and even more problematic, outlier success, when valid, is rarely scalable. In short, “beating the odds” stories make for compelling journalism and politics but not for effective or reasonable education reform. These stories from Florida also raise some red flags. The organization promoting this reform, Children’s Literacy Project, is faith-based. Like other Republican states such as Oklahoma and Texas, Florida is seeking ways to erode the separation of church and state, specifically in public schools. Schools partnering with organizations to promote and support reform is not necessarily a problem, but the outside help does create tensions about ideology as well as erodes the likelihood reforms are scalable. Another few aspects of Florida are not highlighted in the reporting but deserve attention. Returning to measurements of reading proficiency, Florida is in the bottom quartile of states in terms of the standard for “proficient”: Florida, like Mississippi, is also a state where relative success in grade 4 reading quickly evaporates by grade 8: Again like Mississippi, Florida is in the top of states for grade 4 reading on NAEP, but drops to the bottom quartile in grade 8: https://radicalscholarship.com/wp-content/uploads/2025/06/image-6.png Finally, the media and political story most often focuses on reforms in reading programs, teacher training, school leadership, and school expectations; however, outlier and surprising gains in grade 4 reading are likely driven by grade retention (a harmful punishment) and not the celebrated reforms. Notably, high-grade retention states like Florida and Mississippi are also the states with significant decreases from grade 4 to grade 8. Florida has a long history of aligning itself with “miracle” education reform that proves to be a mirage. Beware the current numbers game about reading proficiency—a measurement that changes with the political wind. [1] Thomas, P.L. (2016). Miracle schools or political scam? In W.J. Mathis & T.M. Trujillo, Learning from the Federal Market-Based Reforms: Lessons for ESSA. Charlotte, NC: IAP.)
Thomas’ summary of Grade 8 NAEP Reading results is incomplete and not really revealing.
First, advice in NAEP report cards indicates you need to look at more than overall average scores when you compare states. This is due to the often-wide variations in student demographics (See Pg. 32 in the 2009 NAEP Science Report Card for more on that).
Once the 2024 NAEP Grade 8 Reading results are separately analyzed by race with the NAEP Data Explorer, it turns out that neither Florida’s white students, Black Students nor Hispanic students rank in the bottom quartile for scores.
Florida’s white students rank 33rd out of the 50 states reporting scores. That’s in the 2nd-to-bottom quartile.
Florida’s Black students rank 17th out of 38 states with reported scores. That’s in the 2nd best quartile.
Florida’s Hispanics rank 15th out of 47 states with reported scores. That’s also 2nd best quartile.
It needs to be noted that such rankings do not account for the statistical sampling errors present in all NAEP results. When sampling errors are considered, only 9 states statistically significantly outscore Florida for white students’ results in 2024. Only students in 3 states outscore Florida for Black student results. And, no state has a statistically significantly higher score for Hispanic students than Florida posted in NAEP Grade 8 Reading in 2024.
LikeLike
The correlation between test scores and student’s family income strikingly high. Whether you look at NAEP scores or SAT or any other standardized test scores, the richest are at the top. The poorest are at the bottom. There is no deviation. The more money, the higher the score.
LikeLiked by 1 person
I don’t follow your comment, Diane. Are you saying that Thomas’ work with the NAEP isn’t reliable because the scores mostly just reflect relative wealth? If so, why did you post his comments in the first place?
LikeLike
Paul Thomas is a careful researcher. I am not questioning his comments.
My point was that every standardized test ranks kids by wealth and parent education.
LikeLike
Your “careful researcher” used data you claim is generally just an indicator of wealth. That seems inconsistent, don’t you think?
He also didn’t follow NCES guidelines to compare state results more deeply than just looking at overall average scores. Had he done that, he would have seen that claims Florida ranks in the bottom quartile for NAEP Grade 8 Reading don’t really work.
On a somewhat different note, any decent statistics 101 course makes it clear that correlations do not establish causation. So, despite the prevailing correlation for test scores and relative wealth, with better instruction, students from high poverty systems can do better.
I wrote about some don’t-fit-the-correlation examples from the dirt-poor Appalachian region of Kentucky in this: https://web.archive.org/web/20240529213640/https://www.bipps.org/_files/ugd/7833d4_5617781b9cf24ad68a0cafaff3c08a97.pdf.
Granted Kentucky’s state test standards are far from the most rigorous; but even so, when a Clay County school with an 85% poverty rate (based on true school lunch eligibility not corrupted by the Community Eligibility Project) scores 89.7% third grade proficient for reading, pre-COVID, that is encouraging. When another Clay County school posts 87.5% reading proficiency despite a lunch eligibility rate of 71%, people should be trying to find out how, not trying to disregard what is happening there. Experiences in Clay County, and Laurel County, run counter to the argument that standardized tests are just wealth mirrors. If there is better performance for poor students, testing can show that.
One more point. I pulled the scores for economically disadvantaged students in the 2024 NAEP Grade 8 Reading Assessment from the NAEP Data Explorer along with the percentage of all tested students who were economically disadvantaged in each state. I then checked the correlation between the scores and the percentages. In this state-level comparison, the correlation was very low, just 0.195. Things might look different if examined at the student level, but that can’t be accomplished with the NAEP Data Explorer and requires special licensing, as well. Again, it looks like if poor students do better, testing can show it.
For those interested, I might try to post some of the tables I worked up in X under the @innes434 account.
LikeLike
Correlation is not causation, for sure.
But please cite any standardized test in use that does not show students from high-income homes at the top and students from the poorest homes at the bottom.
What you seem to argue is that stark disparities in family income don’t matter. In fact, if you read Richard Rothstein’s “Class and Schools,” you would know that kids at the bottom have less access to medical care, less food security, are more likely to encounter vermin in their home, are more likely to move from place to place.
So, if you truly believe that kids who don’t have an eye test for glasses, kids who seldom see a dentist, kids who never get their hearing tested, kids who miss school because they are babysitting while mother is working, kids who encounter roaches and mice in their homes–if you truly believe that the academic performance of children in poverty is not affected by the conditions of their lives, then we have a fundamental disagreement and you diverge from the mainstream of social science.
LikeLike